10 High-Risk, Low-Rated Stocks to Avoid
With markets a little "toppy" these days, here are 10 S&P 500 stocks that quants have flagged as risky investment opportunities right now.


Profit and prosper with the best of Kiplinger's advice on investing, taxes, retirement, personal finance and much more. Delivered daily. Enter your email in the box and click Sign Me Up.
You are now subscribed
Your newsletter sign-up was successful
Want to add more newsletters?

Delivered daily
Kiplinger Today
Profit and prosper with the best of Kiplinger's advice on investing, taxes, retirement, personal finance and much more delivered daily. Smart money moves start here.

Sent five days a week
Kiplinger A Step Ahead
Get practical help to make better financial decisions in your everyday life, from spending to savings on top deals.

Delivered daily
Kiplinger Closing Bell
Get today's biggest financial and investing headlines delivered to your inbox every day the U.S. stock market is open.

Sent twice a week
Kiplinger Adviser Intel
Financial pros across the country share best practices and fresh tactics to preserve and grow your wealth.

Delivered weekly
Kiplinger Tax Tips
Trim your federal and state tax bills with practical tax-planning and tax-cutting strategies.

Sent twice a week
Kiplinger Retirement Tips
Your twice-a-week guide to planning and enjoying a financially secure and richly rewarding retirement

Sent bimonthly.
Kiplinger Adviser Angle
Insights for advisers, wealth managers and other financial professionals.

Sent twice a week
Kiplinger Investing Weekly
Your twice-a-week roundup of promising stocks, funds, companies and industries you should consider, ones you should avoid, and why.

Sent weekly for six weeks
Kiplinger Invest for Retirement
Your step-by-step six-part series on how to invest for retirement, from devising a successful strategy to exactly which investments to choose.
They say bull markets climb a wall of worry. And with stocks setting record highs seemingly every other day, it's understandable if some investors are feeling a bit jittery.
Markets never move in a straight line, after all. Valuations, in many cases, do indeed appear to be stretched; the cyclically adjusted P/E (CAPE) ratio of S&P 500 stocks, based on average inflation-adjusted profits over the past 10 years, is at its second-highest level ever. And some of the market's highest-flying bets on economic recovery seem to be getting riskier by the day.
To get a sense of where some of the more dangerous names in the market might lurk right now, we tried something different and turned to quantitative analysis.
Quantitative analysis employs mathematical and statistical models to value stocks. The idea is that a rigorous and dispassionate analysis of fundamentals, technicals, investor sentiment and other factors will yield better stock picks.
Refinitiv Stock Reports Plus provides just such quantitative analysis. The platform employs a weighted mathematical and statistical model that scores stocks on six factors – earnings, fundamentals, relative valuation, risk, price momentum and insider trading – then spits out an overall, or average, score. The scoring scale runs from 1 to 10, with 10 being the best possible grade.
Given investors' heightened awareness of risk in a market that perhaps feels a bit "toppy" these days, we looked for S&P 500 stocks with the worst combination of risk and average scores based on current valuations. For good measure, we also took a look at what Wall Street analysts have to say about some of these riskier names.
Have a look at 10 S&P 500 stocks that quantitative analysis flags for having poor combined risk and overall profiles in this red-hot market. This certainly isn't to say these companies are destined for failure, it's just at current valuations, investment opportunities may fall on the riskier side.
Stocks ranked by risk score, from least to most risky. Share price and other data as of May 7. Quantitative analysis courtesy of Refinitiv Stock Reports Plus. Analysts' consensus recommendations and related data courtesy of S&P Global Market Intelligence, unless otherwise noted.

Tesla
- Market value: $647.4 billion
- Dividend yield: N/A
- Average score: 5
- Risk score: 5
- Analysts' ratings: 9 Strong Buy, 3 Buy, 10 Hold, 5 Sell, 3 Strong Sell
If volatility is a proxy for risk, then Tesla (TSLA, $672.08) stock is always going to be on the riskier side.
Anyone who follows this rollercoaster of a stock chart already knows that. But it shows up in TSLA volatility data, too. For example, shares in the electric vehicle maker have a beta of 1.86, per Refinitiv Stock Reports Plus. In theory, they are 86% more volatile than S&P 500 stocks. What that means in practical terms:
"On days when the market is up, TSLA shares tend to outperform the S&P 500 Index," says Stock Reports Plus, "However, on days when the market is down, the shares generally decrease by more than the index."
That volatility contributes to an overall risk rating of 5 from Stock Reports Plus. To put it in perspective, the S&P 500 gets a risk score of 8.6.
Also hampering TSLA's risk rating is that it actually correlates closely with the broader market, in both the short and long term. Although TSLA tends to move more dramatically than the overall market, the high degree of correlation means it provides "only low levels of diversification to a portfolio similar to the broader market."
At the same time, TSLA gets an overall average score of just 5 out of 10. Although it stands out for high marks on fundamentals – scoring a perfect 10 thanks to strong margins, high revenue growth, a solid balance sheet and high earnings quality – other quantitative factors are more neutral to negative.
A trend of insider selling, mixed earnings expectations and performance, and a poor score for relative valuation all contribute to the middling overall rating on Tesla stock.
Wall Street, as a group, tends to agree with Stock Reports Plus' assessment. The 34 analysts covering TSLA tracked by S&P Global Market Intelligence give the stock a consensus recommendation of Hold.
Credit Suisse analyst Dan Levy, who rates TSLA at Neutral (the equivalent of Hold), points to "lumpy" first-quarter earnings, as well as downside risks such as increased competition and "misexecution" on its growth plans.
PVH
- Market value: $8.4 billion
- Dividend yield: N/A
- Average score: 4
- Risk score: 5
- Analysts' ratings: 5 Strong Buy, 4 Buy, 9 Hold, 1 Sell, 0 Strong Sell
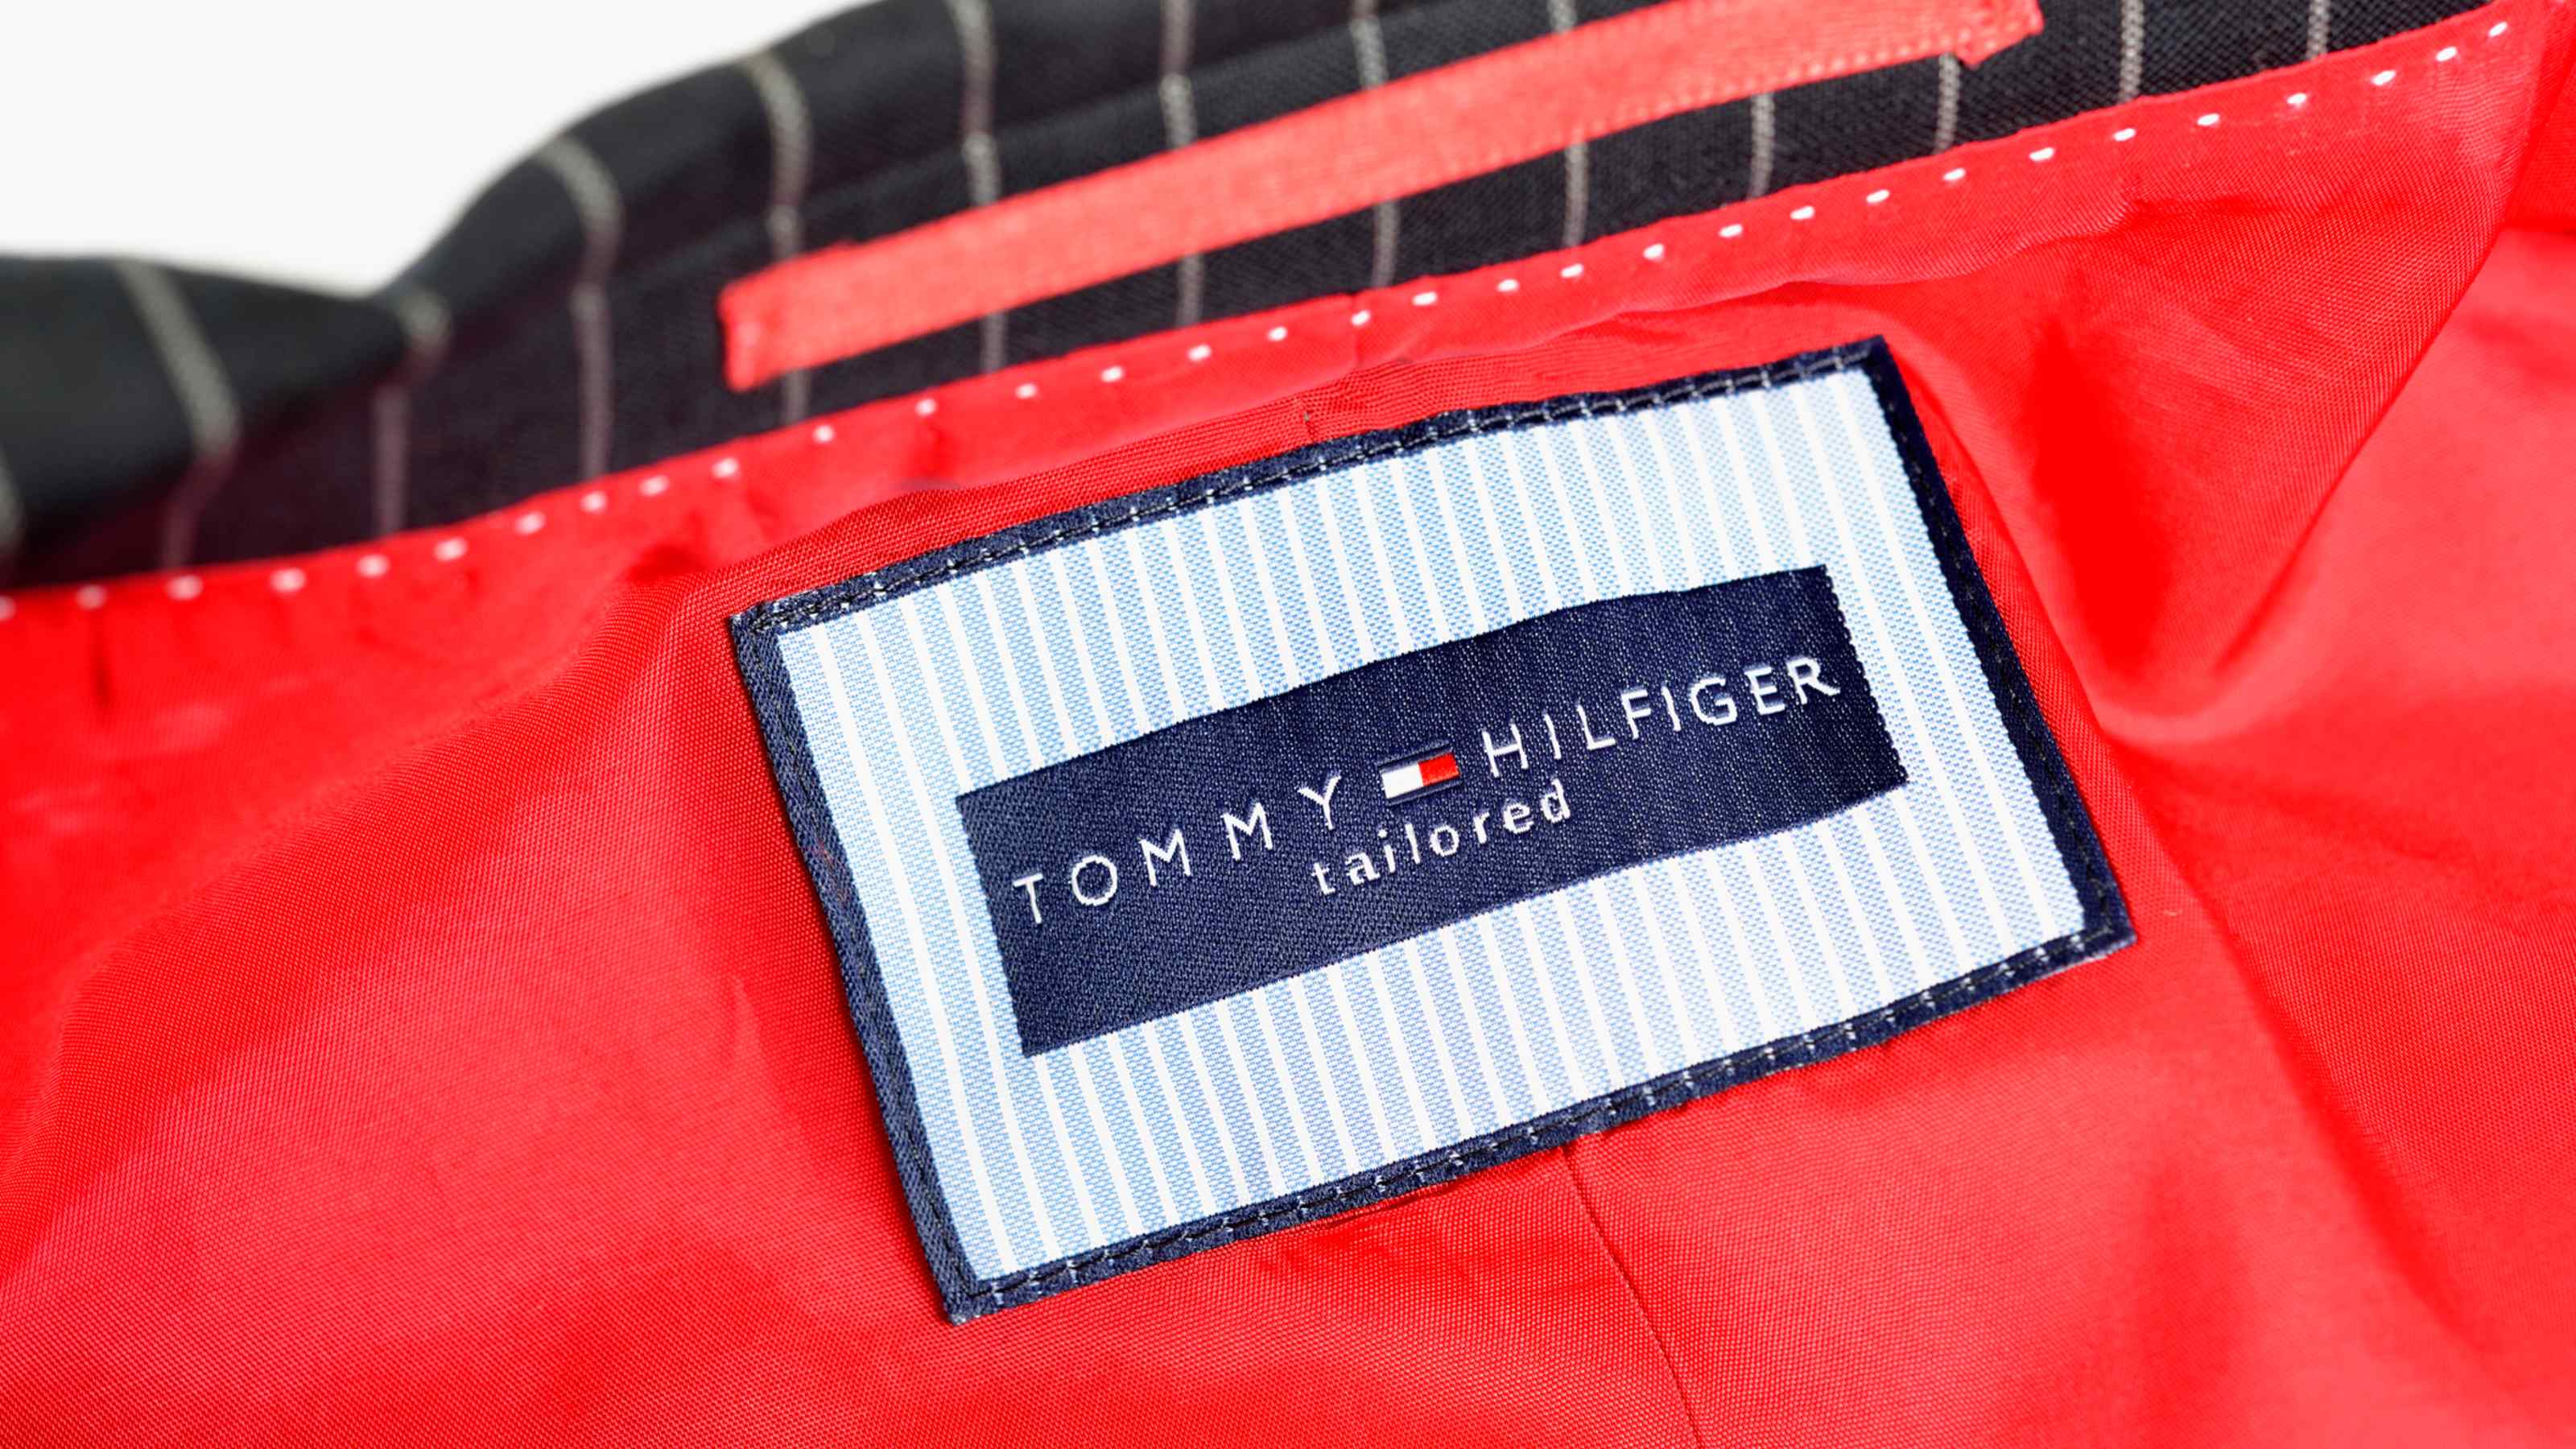
Apparel company PVH (PVH, $118.67) – whose brands include Tommy Hilfiger, Calvin Klein, Van Heusen and Izod – gets an average score of just 4 from Stock Reports Plus, led by low marks on fundamentals and insider trading, and a merely middling rating for risk.
Not only is PVH's risk rating "significantly below" the S&P 500's, but shares have been especially jumpy of late. Over the past 90 days, PVH's daily price fluctuations have exceeded that of 91% of the other S&P 500 stocks.
This drama is nothing new. Over the past five years, PVH logged a monthly best return of 36.4%, while in its worst month it lost 49.2%. By comparison, the S&P 500's best and worst months of the past five years comprised a gain of 12.7% and a loss of 12.5%, respectively.
Price momentum is problematic, too, given that shares are entering a period of poor seasonality. Over the past decade, PVH generated an average return of -5.5% in May.
Weak profitability and an unattractive balance sheet contribute to PVH scoring a meager 3 on fundamental strength. And PVH scored a 2 on insider trading, hurt by trends of both short- and long-term insider selling.
Lastly, PVH garnered a neutral rating of 5 on relative valuation. Although shares trade at a 17% discount to the S&P 500 on a forward price-to-earnings (P/E) basis, they also trade at a 21% premium to their own five-year average.
While PVH garners a consensus Buy recommendation, the Street's average price target of $112.16 gives the stock implied downside from current levels. Worse? Analysts expect earnings per share (EPS) to contract at an average annual rate of 6.3% over the next three to five years.
"While we acknowledge PVH's solid execution in a tough backdrop, we view current valuation as appropriate until there is further visibility around the recovery of North America," writes Deutsche Bank analyst Paul Trussell (Hold).

Under Armour
- Market value: $10.2 billion
- Dividend yield: N/A
- Average score: 5
- Risk score: 5
- Analysts' ratings: 7 Strong Buy, 2 Buy, 16 Hold, 2 Sell, 2 Strong Sell
Under Armour (UAA, $24.47) stock gets a neutral rating for risk, and that's actually one of its better scores when it comes to Stock Reports Plus' grading of various quantitative factors.
True, the athletic apparel and footwear company gets a 7 for earnings, thanks to a relatively high number of analysts upgrading their recommendations. In the past six months, UAA has enjoyed five upgrades vs. just two downgrades.
And UAA gets its highest mark thanks to some technical strength in the S&P 500 stock. The company scores a 9 for price momentum, partly due to positive seasonality. Over the past 10 years, UAA has delivered an average gain of 8.7% in June and another 3.3% in July.
Additionally, the stock's relative strength indicator – a price momentum tool used in technical analysis – is significantly higher than the industry average over the past one-, three- and six-month periods.
Where UAA falls short is in grades for fundamentals and relative valuation. The company gets a lowly 2 for fundamentals, hurt by declining revenue and negative net margins. As for relative valuation – where UAA garners a score of 3 – the stock looks stunningly expensive when compared to the S&P 500, as well as its own five-year average, on a forward P/E basis.
As Kiplinger has noted, UAA is actually a stock worth considering, but only at a much lower price. Meanwhile, analysts' consensus recommendation comes to Hold, according to S&P Global Market Intelligence.
"The second half of 2021 is implied to be flattish/slightly down on the top line given some headwinds such as exiting undifferentiated retailers, fewer off-price sales and demand constraints, as well as uncertainty internationally as COVID continues to see a resurgence in select markets and strong competition in the space," writes B. Riley analyst Susan Anderson (Neutral).

Caesars Entertainment
- Market value: $22.1 billion
- Dividend yield: N/A
- Average score: 4
- Risk score: 4
- Analysts' ratings: 9 Strong Buy, 2 Buy, 3 Hold, 0 Sell, 0 Strong Sell
Caesars Entertainment (CZR, $105.75) is considered by many analysts and investors to be a classic COVID-19 recovery play. But the S&P 500 stock might have traveled too far too fast, at least by Stock Reports Plus' reckoning.
The company, which owns the Caesars Palace, Paris Las Vegas and Bally's Las Vegas, among other properties, was hit hard by the pandemic, and now shares are roaring back in anticipation of a return of customers.
CZR gets a score of only 5 for earnings, hurt by a history of negative earnings surprises. Fundamentals also garner a score of 5, as a decent balance sheet and earnings quality offset poor net margins and a negative return on equity.
But as much as the stock has recovered in 2021, it remains a fairly risky proposition. Shares are more than twice as volatile as the S&P 500. That's great for shareholders on up days – but not so much fun when the market is selling off.
That volatility has been especially noticeable of late. "Over the last 90 days, CZR's daily price fluctuations have exceeded that of 94% of S&P 500 Index firms," says Stock Reports Plus.
Although technical traders will applaud CZR's score of 8 for price momentum, other investors might not be thrilled with its bottom-basement rating for insider trading.
"Caesars Entertainment Inc currently has an Insider Trading Rating of 1, which is significantly more bearish than both the Casinos & Gaming industry average of 4.00 and the Hotels & Entertainment Svcs. industry group average of 4.14," says Stock Reports Plus.
The Street is more bullish on the name than Stock Reports Plus' quantitative assessment would suggest. Indeed, analysts' consensus recommendation stands at Buy. In the bull camp, Stifel analyst Steven Wieczynski says the company's $17 billion merger with Eldorado Resorts last year has yet to get its due.
"We confidently continue with our Buy rating on CZR shares, as we believe the market is largely overlooking the value that stands to be created by combining the legacy Eldorado and CZR portfolios," Wieczynski writes in a note to clients.
Gap
- Market value: $13.3 billion
- Dividend yield: 2.7%
- Average score: 3
- Risk score: 4
- Analysts' ratings: 1 Strong Buy, 3 Buy, 16 Hold, 2 Sell, 0 Strong Sell
Gap (GPS, $35.44) and other mall-based retailers were mauled by the pandemic. Now, as a COVID-19 recovery play, GPS stock is roaring back to the point where it landed among the best stocks of President Biden's first 100 days in office.
The downside to all that GPS upside is that the S&P 500 stock is now too expensive, according to Stock Reports Plus – and it's volatile to boot.
GPS gets a borderline-negative score of 4 for risk, hurt by high volatility vs. the broader market, wide intraday swings and a poor record of adding diversification to a broad-market portfolio. In the past three months alone, GPS has recorded a daily best gain of 7.6%, and a daily worst loss of 7.7%.
Furthermore, GPS' wildness precedes the pandemic by some time. Over the past five years, the stock logged a record best month of a 41.8% gain, and a record worst month in which it fell almost 51%.
As for relative valuation, GPS gets a score of 1. Thanks to a red-hot rally, shares now trade at an 87% premium to their own five-year average by forward P/E. They are 17% more expensive than the S&P 500 by forward P/E, as well. Lastly, the stock is pricey compared to peers, trading at a 30% premium to the rest of the apparel retail industry.
Gap's fundamental score also wallows at 1, with negative revenue growth, negative return on equity and negative net margin, as well as several unfavorable debt metrics.
Although GPS gets the lowest mark possible for insider trading, it does garner a 9 on price momentum, thanks to a number of favorable technical indicators. Shares are heading into a period of strong seasonality, with average gains of 4.1% and 5.6% in June and July, respectively, over the past 10 years.
Still, the Street's consensus recommendation stands at Hold, citing many of the issues noted by Argus Research below.
"We are encouraged by the company's aggressive moves to transform its business and improve performance, and would consider an upgrade on signs of sustained earnings improvement," writes Argus Research analyst Deborah Ciervo. "However, given recent weak comparable-store sales, product assortment issues, and slower traffic trends, along with continued economic uncertainty, our rating remains Hold."

Discovery
- Market value: $17.6 billion
- Dividend yield: N/A
- Average score: 3
- Risk score: 4
- Analysts' ratings: 2 Strong Buy, 3 Buy, 18 Hold, 2 Sell, 0 Strong Sell
Discovery (DISCA, $37.56) posted disappointing first-quarter streaming subscription growth and advertising sales in late April, which only added to analysts' mostly cautious view on the media company's stock.
A quantitative look at DISCA's prospects is likewise lukewarm to negative. Discovery, which owns cable channels such as HGTV, TLC and Animal Planet, gets a risk score of 4 and an overall score of just 3.
Interestingly, over longer time frames, DISCA is actually less volatile than the broader market. It tends to underperform when the S&P 500 is rising, but holds up better when the index is falling. At the same time, it offers little in the way of diversification, and lately has been jumpy on a daily basis.
"Over the last 90 days, the stock's daily price fluctuations have exceeded that of 99% of S&P 500 Index firms," says Stock Reports Plus.
Where shares really fall short are in evaluations of earnings and price momentum. DISCA gets a score of 1 for earnings, hurt by a slew of downward revisions to analysts' earnings estimates. Over the past month, 20 analysts have cut their EPS forecasts, vs. just three upward revisions.
DISCA gets a score of 1 on price momentum, as it's currently in a period of poor seasonal performance. The S&P 500 stock has lost an average of 4.3% in May over the past decade.
Valuation doesn't make a particularly compelling case for DISCA either. The relative valuation score of 6 reflects the fact that shares trade at massive premiums to their own five-year averages by both trailing and forward P/Es.
Indeed, UBS Global Research slashed its recommendation in late March, citing valuation.
"We are downgrading DISCA to Sell from Neutral as the risk-reward has become more challenging at current levels," writes analyst John Hodulik. "While discovery+ appears off to a strong start, we remain concerned regarding the ultimate scalability of the service in relation to the decline of the linear business and longer term impact on financials."
The Street's consensus recommendation on DISCA stands at Hold, per S&P Global Market Intelligence.

Royal Caribbean Cruises
- Market value: $21.5 billion
- Dividend yield: N/A
- Average score: 1
- Risk score: 4
- Analysts' ratings: 5 Strong Buy, 2 Buy, 7 Hold, 2 Sell, 2 Strong Sell
Cruise line stocks have caught a strong tailwind in 2021 on expectations the major lines will hit the open waters again this year, but Wall Street pros harbor concerns that some names may be too pricey or risky at current levels.
Royal Caribbean Cruises (RCL, $84.29), which gets a consensus Hold recommendation from analysts and the worst possible average score from Stock Reports Plus, looks like a name from which most investors should jump ship.
RCL gets an average score of 1, led by grades of 1 for both fundamentals and insider trading. The risk score of 4 actually helps the stock in that light, but that's not exactly reassuring.
RCL is roughly twice as volatile as the broader group of S&P 500 stocks. High volatility is generally bad because it increases the number of opportunities for investors to buy high and sell low.
Meanwhile, daily returns over the past three months range from a gain of 9.7% to a loss of 5.6%. On a monthly basis going back five years, the range widens from a gain of 45.4% to a loss of 60%.
RCL's bottom-basement score for fundamentals hinges on collapses in revenue, gross and net margins, and a negative return on equity. Indeed, RCL has the lowest gross margin – the difference between revenue and cost of goods sold – in its industry.
The insider trading score of 1 stems from short- and long-term trends of insider selling. And second-quarter insider selling hit a five-year high for that three-month period.
The bottom line on the Street is that analysts' consensus recommendation stands at Hold, per S&P Global Market Intelligence.
"While the vaccine rollout has provided some optimism, the timing for a potential return to some semblance of normalcy seems highly tenuous at best," writes CFRA analyst Tuna Amobi (Hold). "A return to pre-pandemic revenue seems several years out."

American Airlines
- Market value: $14.1 billion
- Dividend yield: N/A
- Average score: 3
- Risk score: 4
- Analysts' ratings: 2 Strong Buy, 0 Buy, 9 Hold, 3 Sell, 7 Strong Sell
American Airlines (AAL, $22.00) gets a rare consensus Sell recommendation from Wall Street analysts and doesn't fare much better in grades from Stock Reports Plus.
Although some air carriers are thought to have potential as recovery plays, analysts and quants see better alternatives to AAL in the industry. Indeed, American Airlines' risk score of 4 is actually one of its better grades. High volatility – especially over the past three months – hurt its risk profile, as does a history of large intraday swings.
Although AAL gets an impressive 8 out of 10 for earnings – thanks partly to analysts upgrading their recommendations and EPS estimates – most other quant measures come up wanting.
Price momentum scores at 3, hurt by poor seasonality. AAL has lost an average of 4.1% in May over the past 10 years. June and July have delivered positive returns, albeit ones that lagged most of its industry peers.
AAL receives a score of 4 for insider trading, which is another negative factor in Stock Reports Plus' calculations. The mark is, however, higher than the industry average of 3.38.
Fundamental factors are where AAL's assessment really gets ugly. Its lowest possible score of 1 stems, in part, from having the highest debt-to-capital ratio in the industry, as well as declining revenue and a lack of profitability.
As noted above, analysts' consensus recommendation stands at Sell, according to a survey by S&P Global Market Intelligence. Argus Research won't go that far, but it remains steadfastly cautious on the S&P 500 stock.
"We are maintaining our Hold rating on AAL, which had been hurt by the grounding of the 737 MAX, is wrestling with COVID-19 and high debt levels," writes Argus Research analyst John Staszak. "With air travel demand only now beginning to increase, we think that lower operating expenses and a low interest rate environment will provide only partial relief to American and other airlines."

Occidental Petroleum
- Market value: $25.6 billion
- Dividend yield: 0.2%
- Average score: 2
- Risk score: 3
- Analysts' ratings: 5 Strong Buy, 0 Buy, 17 Hold, 2 Sell, 2 Strong Sell
Oil and gas companies are some of the hottest recovery plays to be found. Some might say they are also among the most speculative. Occidental Petroleum (OXY, $27.39), with a consensus recommendation of Hold, poor quant scores and a soaring stock price, appears to fit both bills.
OXY, up by more than half so far in 2021 and by 150% over the past six months, gets a risk score of 3 due to high volatility. With a beta of 2.29, it tends to greatly outperform the S&P 500 in up markets, but fall much more sharply in down ones.
Over the past 90 days, OXY has generated an average intraday price swing of 4.9%. It's best single daily return came to 12.8%, but it slumped 8.3% in its worst trading session. In other words, its daily price fluctuations have exceeded that of 98% of S&P 500 stocks in the past three months.
With all the demand destruction COVID-19 brought to the oil patch, it should come as no surprise that OXY gets a fundamental score of 1. Among the lowlights are declining revenue, a lack of profitability, negative return on equity and blemishes on the balance sheet.
Where OXY shines is in its score of 7 for earnings, helped by upward revisions to EPS estimates and analyst upgrades. Five analysts have hiked their recommendations on the stock over the past six months vs. two downgrades.
An insider trading score of 4 is neutral, but on the cusp of negative, while a negative price momentum score of 3 suggests investors shouldn't expect much help from the stock's technicals.
CFRA Research rates OXY at Hold, which is by a wide margin the Street's majority view on shares.
"We think management will focus near-term on debt reduction, and so long as crude oil prices stay buoyant in the $60 per barrel range, we think this is very possible," writes CFRA Research analyst Stewart Glickman. "The risk in our view is that crude prices once again relapse, which could jeopardize non-core asset sales at the same time as cash flows suffer."

Enphase Energy
- Market value: $16.7 billion
- Dividend yield: N/A
- Average score: 3
- Risk score: 2
- Analysts' ratings: 7 Strong Buy, 6 Buy, 6 Hold, 0 Sell, 0 Strong Sell
Enphase Energy (ENPH, $122.96) gets a solid consensus Buy recommendation from the Street, but even bullish analysts worry about its risk profile.
ENPH, which provides solar power and storage systems for individual homes, was one of the hottest green energy stocks of 2020, gaining more than 570%. But shares have tumbled by nearly a third so far this year, hurt partly by the global semiconductor shortage that's wreaking havoc across a multitude of industries.
The share price's longer-term rollercoaster ride, as well as wide daily price swings, give it the worst risk score of any S&P 500 stock on this list. To get a sense of the drama, over the past three months, ENPH logged a daily best return of 12.6% and a daily worst loss of 14.1%. Furthermore, it sports an intraday average swing of 7% over the past 90 days.
Also knocking the stock's overall rating is relative valuation, which garners a score of 2. Even after plunging 37% over the past three months, shares still look expensive. The forward P/E multiple of 61.3 is almost a third higher than the stock's own long-term average, and far exceeds that of the S&P 500, which stands at around 23. Shares are even more expensive on a trailing earnings basis.
Happily for shareholders, ENPH gets a perfect 10 on fundamentals. Even more impressive is how that score compares with peers. Stock Reports Plus notes that the renewable energy services industry carries an average fundamental score of just 5.4.
Fundamental highlights include high revenue growth, healthy margins and a solid balance sheet. The company scores a middling grade of 6 for earnings, however, suffering 17 downward revisions to EPS estimates from analysts over the past month. No analysts upped their earnings estimates over that time period.
As for insider trading, ENPH gets a score of 1, hurt by higher-than-average insider selling recently.
Supply chain concerns, tighter competition and an overcrowded trade have some analysts sounding a note of caution on the name.
"Enphase remains among the most crowded trades in clean tech," writes Raymond James analyst Pavel Molchanov, who rates the stock at Market Perform (Hold). "Our fundamental concern is the risk of medium-term margin pressure to below-target levels, amid increasing competition in microinverters and (especially) batteries."
Profit and prosper with the best of Kiplinger's advice on investing, taxes, retirement, personal finance and much more. Delivered daily. Enter your email in the box and click Sign Me Up.

Dan Burrows is Kiplinger's senior investing writer, having joined the publication full time in 2016.
A long-time financial journalist, Dan is a veteran of MarketWatch, CBS MoneyWatch, SmartMoney, InvestorPlace, DailyFinance and other tier 1 national publications. He has written for The Wall Street Journal, Bloomberg and Consumer Reports and his stories have appeared in the New York Daily News, the San Jose Mercury News and Investor's Business Daily, among many other outlets. As a senior writer at AOL's DailyFinance, Dan reported market news from the floor of the New York Stock Exchange.
Once upon a time – before his days as a financial reporter and assistant financial editor at legendary fashion trade paper Women's Wear Daily – Dan worked for Spy magazine, scribbled away at Time Inc. and contributed to Maxim magazine back when lad mags were a thing. He's also written for Esquire magazine's Dubious Achievements Awards.
In his current role at Kiplinger, Dan writes about markets and macroeconomics.
Dan holds a bachelor's degree from Oberlin College and a master's degree from Columbia University.
Disclosure: Dan does not trade individual stocks or securities. He is eternally long the U.S equity market, primarily through tax-advantaged accounts.
-
 Betting on Super Bowl 2026? New IRS Tax Changes Could Cost You
Taxable Income When Super Bowl LX hype fades, some fans may be surprised to learn that sports betting tax rules have shifted.
-
 How Much It Costs to Host a Super Bowl Party in 2026
Hosting a Super Bowl party in 2026 could cost you. Here's a breakdown of food, drink and entertainment costs — plus ways to save.
-
 3 Reasons to Use a 5-Year CD As You Approach Retirement
A five-year CD can help you reach other milestones as you approach retirement.
-
 Dow Leads in Mixed Session on Amgen Earnings: Stock Market Today
The rest of Wall Street struggled as Advanced Micro Devices earnings caused a chip-stock sell-off.
-
 Nasdaq Slides 1.4% on Big Tech Questions: Stock Market Today
Palantir Technologies proves at least one publicly traded company can spend a lot of money on AI and make a lot of money on AI.
-
 Fed Vibes Lift Stocks, Dow Up 515 Points: Stock Market Today
Incoming economic data, including the January jobs report, has been delayed again by another federal government shutdown.
-
 Stocks Close Down as Gold, Silver Spiral: Stock Market Today
A "long-overdue correction" temporarily halted a massive rally in gold and silver, while the Dow took a hit from negative reactions to blue-chip earnings.
-
 Nasdaq Drops 172 Points on MSFT AI Spend: Stock Market Today
Microsoft, Meta Platforms and a mid-cap energy stock have a lot to say about the state of the AI revolution today.
-
 S&P 500 Tops 7,000, Fed Pauses Rate Cuts: Stock Market Today
Investors, traders and speculators will probably have to wait until after Jerome Powell steps down for the next Fed rate cut.
-
 S&P 500 Hits New High Before Big Tech Earnings, Fed: Stock Market Today
The tech-heavy Nasdaq also shone in Tuesday's session, while UnitedHealth dragged on the blue-chip Dow Jones Industrial Average.
-
 Dow Rises 313 Points to Begin a Big Week: Stock Market Today
The S&P 500 is within 50 points of crossing 7,000 for the first time, and Papa Dow is lurking just below its own new all-time high.
