How the Stock Market Performed in the First 6 Months of Trump's Second Term
Six months after President Donald Trump's inauguration, multiple stock market indexes are at all-time highs.


Profit and prosper with the best of Kiplinger's advice on investing, taxes, retirement, personal finance and much more. Delivered daily. Enter your email in the box and click Sign Me Up.
You are now subscribed
Your newsletter sign-up was successful
Want to add more newsletters?

Delivered daily
Kiplinger Today
Profit and prosper with the best of Kiplinger's advice on investing, taxes, retirement, personal finance and much more delivered daily. Smart money moves start here.

Sent five days a week
Kiplinger A Step Ahead
Get practical help to make better financial decisions in your everyday life, from spending to savings on top deals.

Delivered daily
Kiplinger Closing Bell
Get today's biggest financial and investing headlines delivered to your inbox every day the U.S. stock market is open.

Sent twice a week
Kiplinger Adviser Intel
Financial pros across the country share best practices and fresh tactics to preserve and grow your wealth.

Delivered weekly
Kiplinger Tax Tips
Trim your federal and state tax bills with practical tax-planning and tax-cutting strategies.

Sent twice a week
Kiplinger Retirement Tips
Your twice-a-week guide to planning and enjoying a financially secure and richly rewarding retirement

Sent bimonthly.
Kiplinger Adviser Angle
Insights for advisers, wealth managers and other financial professionals.

Sent twice a week
Kiplinger Investing Weekly
Your twice-a-week roundup of promising stocks, funds, companies and industries you should consider, ones you should avoid, and why.

Sent weekly for six weeks
Kiplinger Invest for Retirement
Your step-by-step six-part series on how to invest for retirement, from devising a successful strategy to exactly which investments to choose.
Let's say you wanted to place the broadest possible bet on the stock market during the second Trump administration. So, at the closing bell of the New York Stock Exchange at 4 pm Eastern Time on January 17, 2025, you bought the Wilshire 5000 Index Fund (WFIVX), as comprehensive a vehicle as there is available.
From Friday, January 17, through Friday, July 18, WFIVX generated a total return of 4.8%. Broadly speaking, then, the stock market is up during the first six months of the second Trump administration.
But most of us experience the stock market at the headline level (especially during the second Trump administration). And the Wilshire 5000, which, as of June 30, included 3,289 publicly traded companies from $50 million micro-caps such as Natural Health Trends (NHTC) to $4 trillion mega-caps such as Nvidia (NVDA), rarely makes headlines. That relatively light 4.8% return doesn't reflect the overall feeling of the market so far in this administration.
From just $107.88 $24.99 for Kiplinger Personal Finance
Become a smarter, better informed investor. Subscribe from just $107.88 $24.99, plus get up to 4 Special Issues

Sign up for Kiplinger’s Free Newsletters
Profit and prosper with the best of expert advice on investing, taxes, retirement, personal finance and more - straight to your e-mail.
Profit and prosper with the best of expert advice - straight to your e-mail.
The journey looks better in sharper focus: The S&P 500 and the Nasdaq Composite are trading near all-time highs, and the Dow Jones Industrial Average is knocking on a new peak of its own. The S&P 500 has returned 5.7% since January 17, the Nasdaq 6.8% and the Dow 2.9%.
And perhaps only cryptocurrency and bitcoin capture the absolutely risk-on nature of the stock market so far into No. 47's tenure. Crypto is now a $4 trillion market, and bitcoin recently crossed $120,000 for the first time.
As with anything, the numbers alone don't tell the whole story, and growth has not been a straightforward upward climb. So, how is the stock market performing under Donald Trump's second term as president so far? Let's break it down.
The map and the terrain of the stock market under Trump
To simply say the stock market is up during the first six months of the second Trump administration doesn't show you very much beyond the basic trajectory from point A to point B. It is, as they say, the difference between the "map" and the "terrain." It avoids discussion of the historic volatility and market-moving uncertainty since Trump returned to the White House.
The list of Trump's market-impacting policies includes trade wars and tariffs, immigration crackdowns and labor market stressors, energy security and nuclear power, cryptocurrency regulation and a bitcoin reserve… and real, actual war in Central Europe and the Middle East.
Prices of some assets have moved simply because they're Trump-related, with little more than a general personality trend and some headline-driven momentum supporting them. That's what happens in a bull market – and it has been a bull market six months into the second Trump administration.
The story of stocks' performance under Trump
Let's take a look back at the first Trump presidency. During the first six months of the first go-around, the Wilshire 5000 Index Fund generated a total return of 9.3%. And, before the COVID-19 pandemic sell-off, the main U.S. equity indexes were pushing out to new all-time highs.
Stocks resumed their long-term up-and-to-the-right trajectory within months of the initial February 2020 crash. In fact, returns of 13.6% per year during Trump's first presidency made him one of the best presidents based on stock market performance, between Barack Obama (12.8%) and Bill Clinton (15.0%).
After Trump was elected for a second time last November, investors traded with apparent optimism that we would again see growth. They only hit a stumble in late winter, when DeepSeek temporarily sidetracked the AI Revolution.
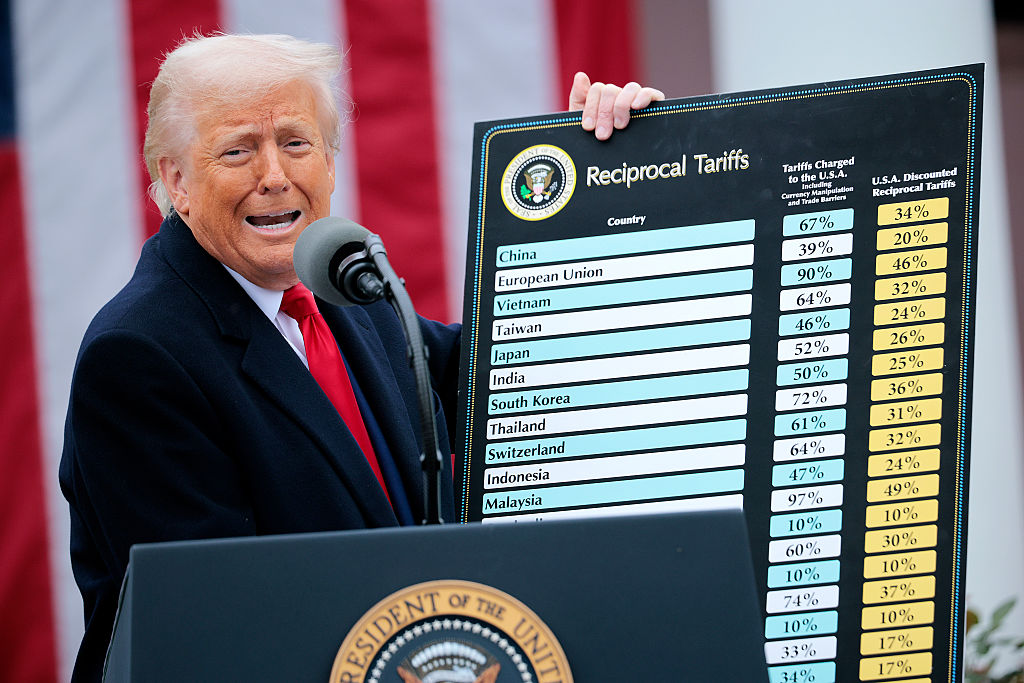
Stocks moved sideways until "Liberation Day" on April 2 defined the spring of the second administration – and redefined the Trump Trade. The S&P 500 declined more than 10% over the next two trading sessions, the president's announcement immolating nearly $7 trillion in total stock market value by April 4. After that, Trump paused the tariffs for a period and, since that initial shock, the market has largely grown to the historic heights we're seeing now.

It's also important to appreciate price action beyond equities, primarily in the yield on the 10-year U.S. Treasury note. The 10-year U.S. Treasury yield – a key benchmark for the global financial system and a critical baseline for many big-ticket consumer purchases – has fluctuated as much as the stock market amid tariff-related uncertainty.
The yield on the 10-year hit a 52-week high of 4.896% on January 13, a week before Trump's second inauguration, and traded as low as 3.860% on April 4 before spiking to 4.607% on May 21, then settling at 4.431% on July 18.
Market observers have also questioned the future of the U.S. dollar as the linchpin of the global economic system.
But, with the headline-generating equity indexes at all-time highs, it's fair to say it's a bull market, no matter how exactly we got there.
And, after the last six months, it's hard to see what would bring investors, traders and speculators back to pessimism sufficient enough to sustain a bear market over a meaningful period – other than a major worldwide catastrophe of uncontemplated proportions.
How ETFs are doing during the second Trump administration

All that said, most of us are exposed to the stock market through IRA and 401(k) accounts and index-based exchange-traded and mutual funds, so let's look at that performance.
The Vanguard S&P 500 ETF (VOO) – the biggest of the S&P 500 ETFs – generated a total return of 5.7% from January 17 through July 18, as you might expect given the underlying index's performance. Top holdings include NVDA as well as Microsoft (MSFT) and Apple (AAPL).
Crypto is enjoying a Trump-supported renaissance not yet two decades into its existence, with the best bitcoin ETFs such as the iShares Bitcoin Trust ETF (IBIT) built to capture its full flowering.
IBIT is up 11.8% during the second Trump administration. IBIT has surged on the promise and now the passage and signature into law by President Trump of the first major cryptocurrency legislation in the U.S.
The VanEck Uranium+Nuclear Energy ETF (NLR) – an efficient way to invest in the nuclear revolution – has outperformed VOO (and NVDA, for that matter) since January 17 with a return of 34.2% through July 18. NLR's outperformance is a reaction to four executive orders to accelerate the U.S. nuclear industry signed by President Trump in late May.
Meanwhile, financials are good bellwethers because of their broad and diverse exposure to multiple levels of financial and real-world market activity. That the Financial Select Sector SPDR Fund (XLF) is up 5.3% suggests it's one of the best SPDR ETFs to buy and hold and that it's steady as it goes so far in the second Trump administration.
How stocks are doing during the second Trump administration
At the end of the day, it's a market of stocks. Components drive indexes. Some provide the gas, some provide the brakes.
Nvidia is the gas for the whole stock market – and maybe the entire economy too. NVDA – still tops among the Magnificent 7 – was a $322.5 billion stock on January 19, 2021, the day Trump officially left the White House the first time around.
As of July 18, Nvidia is the most valuable publicly traded company ever at $4.2 trillion. Helped by recent favorable adjustments for semiconductors in Trump's tariffs policy, NVDA stock has risen 25.2% since his return to the White House to a new all-time high as of July 18.

Another large-cap tech stock, Palantir Technologies (PLTR), is the top-performing stock in the S&P 500 since January 17, though following a run of 113.9%, it's earned a place on the list of the riskiest S&P 500 stocks right now. At the same time, PLTR's capabilities demand a premium, similarly reflected in defense stock Howmet Aerospace (HWM) and its 52.2% Trump II gain.
Tesla (TSLA), meanwhile, has enjoyed the ecstasy and the agony of its once-tight but since-frayed ties to the White House. TSLA soared 94.3% to an all-time intraday high of $488.54 after Trump's election, then fell 56.1% when CEO Elon Musk began to question the president about taxes and spending.
TSLA stock has ultimately lost 22.7% since January 17 amid questions about Musk's priorities.
UnitedHealth Group (UNH) has weighed down the Dow Jones Industrial Average in recent months due to foul business practices in its Medicare Advantage unit, erasing 43.9% of its value.
And finally, for the record, Trump Media & Technology (DJT) is down 53.6% since its namesake's inauguration.
Related content
Profit and prosper with the best of Kiplinger's advice on investing, taxes, retirement, personal finance and much more. Delivered daily. Enter your email in the box and click Sign Me Up.

David Dittman is the former managing editor and chief investment strategist of Utility Forecaster, which was named one of "10 investment newsletters to read besides Buffett's" in 2015. A graduate of the University of California, San Diego, and the Villanova University School of Law, and a former stockbroker, David has been working in financial media for more than 20 years.
-
 The New Reality for Entertainment
The Kiplinger Letter The entertainment industry is shifting as movie and TV companies face fierce competition, fight for attention and cope with artificial intelligence.
-
 Stocks Sink With Alphabet, Bitcoin: Stock Market Today
A dismal round of jobs data did little to lift sentiment on Thursday.
-
 Betting on Super Bowl 2026? New IRS Tax Changes Could Cost You
Taxable Income When Super Bowl LX hype fades, some fans may be surprised to learn that sports betting tax rules have shifted.
-
 Stocks Sink With Alphabet, Bitcoin: Stock Market Today
A dismal round of jobs data did little to lift sentiment on Thursday.
-
 The 4 Estate Planning Documents Every High-Net-Worth Family Needs (Not Just a Will)
The key to successful estate planning for HNW families isn't just drafting these four documents, but ensuring they're current and immediately accessible.
-
 Love and Legacy: What Couples Rarely Talk About (But Should)
Couples who talk openly about finances, including estate planning, are more likely to head into retirement joyfully. How can you get the conversation going?
-
 How to Get the Fair Value for Your Shares When You Are in the Minority Vote on a Sale of Substantially All Corporate Assets
When a sale of substantially all corporate assets is approved by majority vote, shareholders on the losing side of the vote should understand their rights.
-
 Dow Leads in Mixed Session on Amgen Earnings: Stock Market Today
The rest of Wall Street struggled as Advanced Micro Devices earnings caused a chip-stock sell-off.
-
 How to Add a Pet Trust to Your Estate Plan: Don't Leave Your Best Friend to Chance
Adding a pet trust to your estate plan can ensure your pets are properly looked after when you're no longer able to care for them. This is how to go about it.
-
 Want to Avoid Leaving Chaos in Your Wake? Don't Leave Behind an Outdated Estate Plan
An outdated or incomplete estate plan could cause confusion for those handling your affairs at a difficult time. This guide highlights what to update and when.
-
 I'm a Financial Adviser: This Is Why I Became an Advocate for Fee-Only Financial Advice
Can financial advisers who earn commissions on product sales give clients the best advice? For one professional, changing track was the clear choice.