"Below-Average" Stocks With Above-Average Potential
Fundamental investors shouldn't ignore charts completely. Here, we look at a few opportunities as signaled by their 200-day moving average (MA).


Profit and prosper with the best of Kiplinger's advice on investing, taxes, retirement, personal finance and much more. Delivered daily. Enter your email in the box and click Sign Me Up.
You are now subscribed
Your newsletter sign-up was successful
Want to add more newsletters?

Delivered daily
Kiplinger Today
Profit and prosper with the best of Kiplinger's advice on investing, taxes, retirement, personal finance and much more delivered daily. Smart money moves start here.

Sent five days a week
Kiplinger A Step Ahead
Get practical help to make better financial decisions in your everyday life, from spending to savings on top deals.

Delivered daily
Kiplinger Closing Bell
Get today's biggest financial and investing headlines delivered to your inbox every day the U.S. stock market is open.

Sent twice a week
Kiplinger Adviser Intel
Financial pros across the country share best practices and fresh tactics to preserve and grow your wealth.

Delivered weekly
Kiplinger Tax Tips
Trim your federal and state tax bills with practical tax-planning and tax-cutting strategies.

Sent twice a week
Kiplinger Retirement Tips
Your twice-a-week guide to planning and enjoying a financially secure and richly rewarding retirement

Sent bimonthly.
Kiplinger Adviser Angle
Insights for advisers, wealth managers and other financial professionals.

Sent twice a week
Kiplinger Investing Weekly
Your twice-a-week roundup of promising stocks, funds, companies and industries you should consider, ones you should avoid, and why.

Sent weekly for six weeks
Kiplinger Invest for Retirement
Your step-by-step six-part series on how to invest for retirement, from devising a successful strategy to exactly which investments to choose.
Traders pay close attention to the 200-day moving average (MA) when evaluating stocks. But even if you're a mostly fundamentals-based investor, perhaps you should too.
For the uninitiated: The 200-day moving average is a frequently used stock-chart indicator calculated by adding up the closing prices for each of the last 200 days, then dividing by 200. As a result, each day offers a new data point, which is then smoothed out to produce a trendline.
When a stock price moves below the 200-day moving average, it's considered a bearish signal indicating a likely downward trend in the stock. When the price moves above, it's a bullish signal. The 200-day moving average also establishes prices where the stock will, in theory, meet "support" (where the line provides something of a temporary low-water mark for the stock price) or "resistance" (where the line provides something of a temporary high-water mark for the stock price).
From just $107.88 $24.99 for Kiplinger Personal Finance
Become a smarter, better informed investor. Subscribe from just $107.88 $24.99, plus get up to 4 Special Issues

Sign up for Kiplinger’s Free Newsletters
Profit and prosper with the best of expert advice on investing, taxes, retirement, personal finance and more - straight to your e-mail.
Profit and prosper with the best of expert advice - straight to your e-mail.
While "technical" traders often use the 200-day MA in concert with other chart indicators, more fundamental-based investors can also get some utility out of it. You see, many stocks dip below this 200-day moving average because of deteriorating fundamentals. But sometimes, if the stock of a great company with great management happens to fall below it, chances are those companies will take steps to improve their performance and return to fiscal health – and when that happens, the stock could be sent back up through the 200-day MA, and enjoy additional technical buying as a result.
We'll provide a few ideas of how to take advantage of this kind of situation.
The following three stocks are currently trading below their 200-day moving average. We've focused on a handful of stocks that have lost their momentum over the past few months and underperformed the market. While they appear to be temporarily on the ropes, there are legitimate fundamental reasons to believe these companies can jump back through the 200-day MA. Among other things, each stock receives high marks from Value Line for their financial strength. (Note: All data is as of Oct. 17)
Fiserv
- Market value: $72.7 billion
- 200-day moving average: $113.85
Fiserv (FISV, $109.80), an internet banking, bill payment and card processing company, acquired First Data for $22 billion in July 2019. Though the deal has delivered solid top-line results, it still defines the struggles the stock has faced.
Namely: FISV stock is trading at the same price today as it was when the deal was consummated.
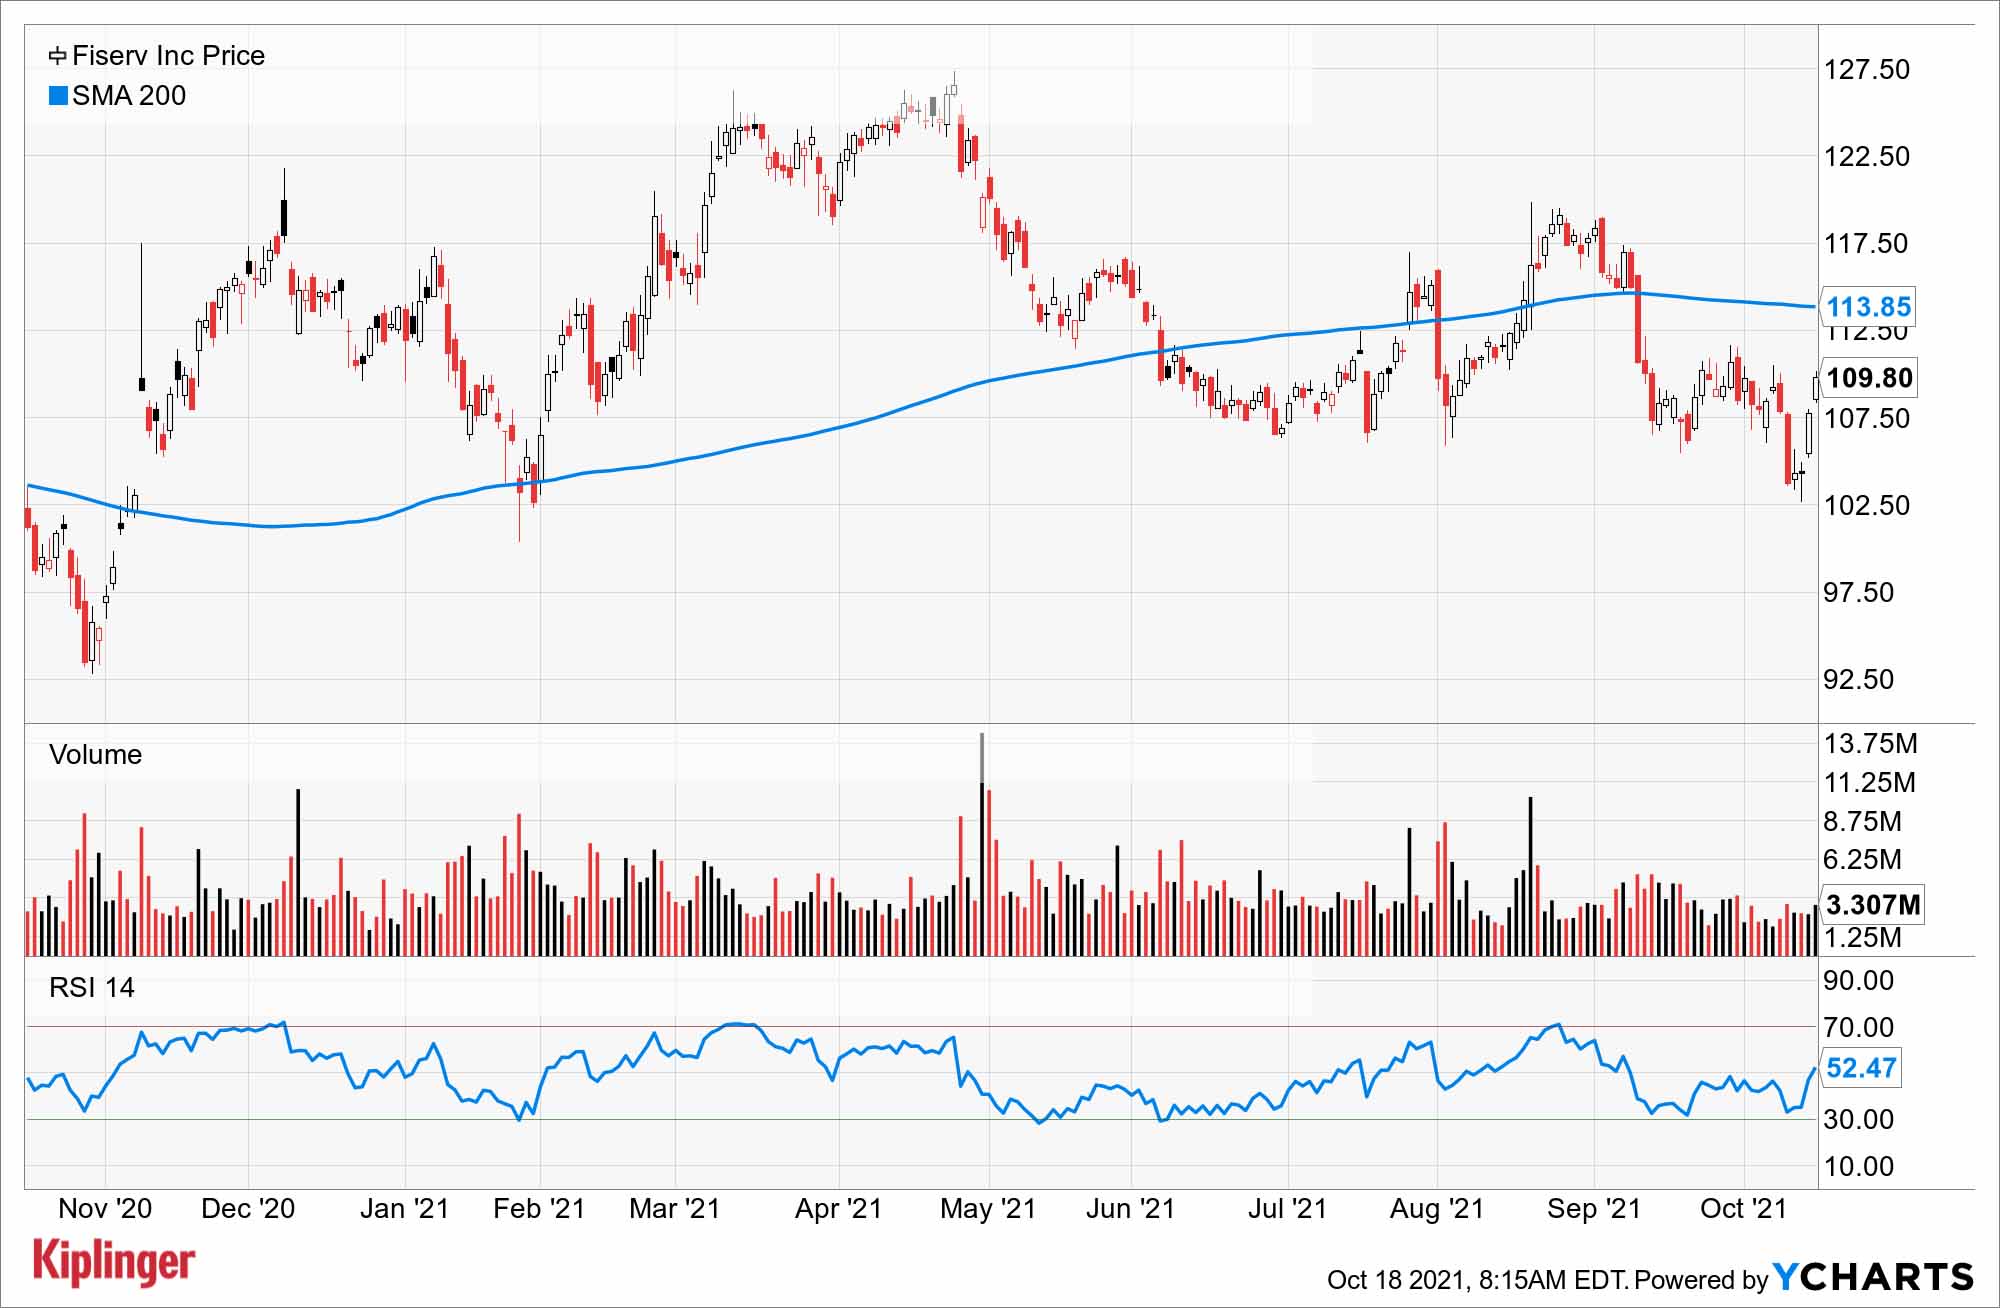
Fresh investor malaise has sent Fiserv shares below its 200-day moving average, and there are at minimum two very good reasons for this. First, the acquisition left the company with a heavier debt load – from $2 billion to about $22 billion. At the time of the deal, interest expense grew from a modest $200 million to the current load of $700 million as of the most recent annual report. Plus, this is one of the main drivers taking down total GAAP earnings from $1.2 billion in 2018 to about $950 million as of the end of 2020.
The second reason for investor reticence may be that Fiserv's financial performance can be difficult to understand. In the most recently reported quarter, GAAP earnings were 40 cents per share, while "adjusted" earnings per share (EPS) were, at $1.37, more than 300% higher, owing to amortization of intangible assets, integration costs and testy tax issues in the U.K. and Argentina.
However, the merger has delivered handsomely on the top line, taking revenues for Fiserv from about $6 billion pre-deal to a consensus estimate of $15.4 billion for this year. And depending on your feelings about the post merger adjustments, earnings have grown from about $900 million pre-deal $3 billion last year. While the debt load looms, the heft of the combined organization offers a reasonable prospect that Fiserv is growing its way to a less levered position. All in, the adjustments to earnings, which play so prominently in the company's performance today, will ultimately come to pass with time.
Meanwhile investors can take comfort in that great elixir: free cash flow (FCF), or the cash remaining after a company has paid its expenses, interest on debt, taxes and long-term investments to grow its business. Since the quarter before the First Data deal was complete, Fiserv's FCF is up more than 850%.
Mastercard
- Market value: $351.3 billion
- 200-day moving average: $360.88
Mastercard (MA, $356.00) suffered declines on the top and bottom lines due mainly to pandemic-driven changes in consumer spending. In 2021, Mastercard appears to have regained its upward operational trajectory, but shares have nonetheless slumped by about 10% since the company's second-quarter earnings at the end of July, knocking shares back below their 200-day moving average.
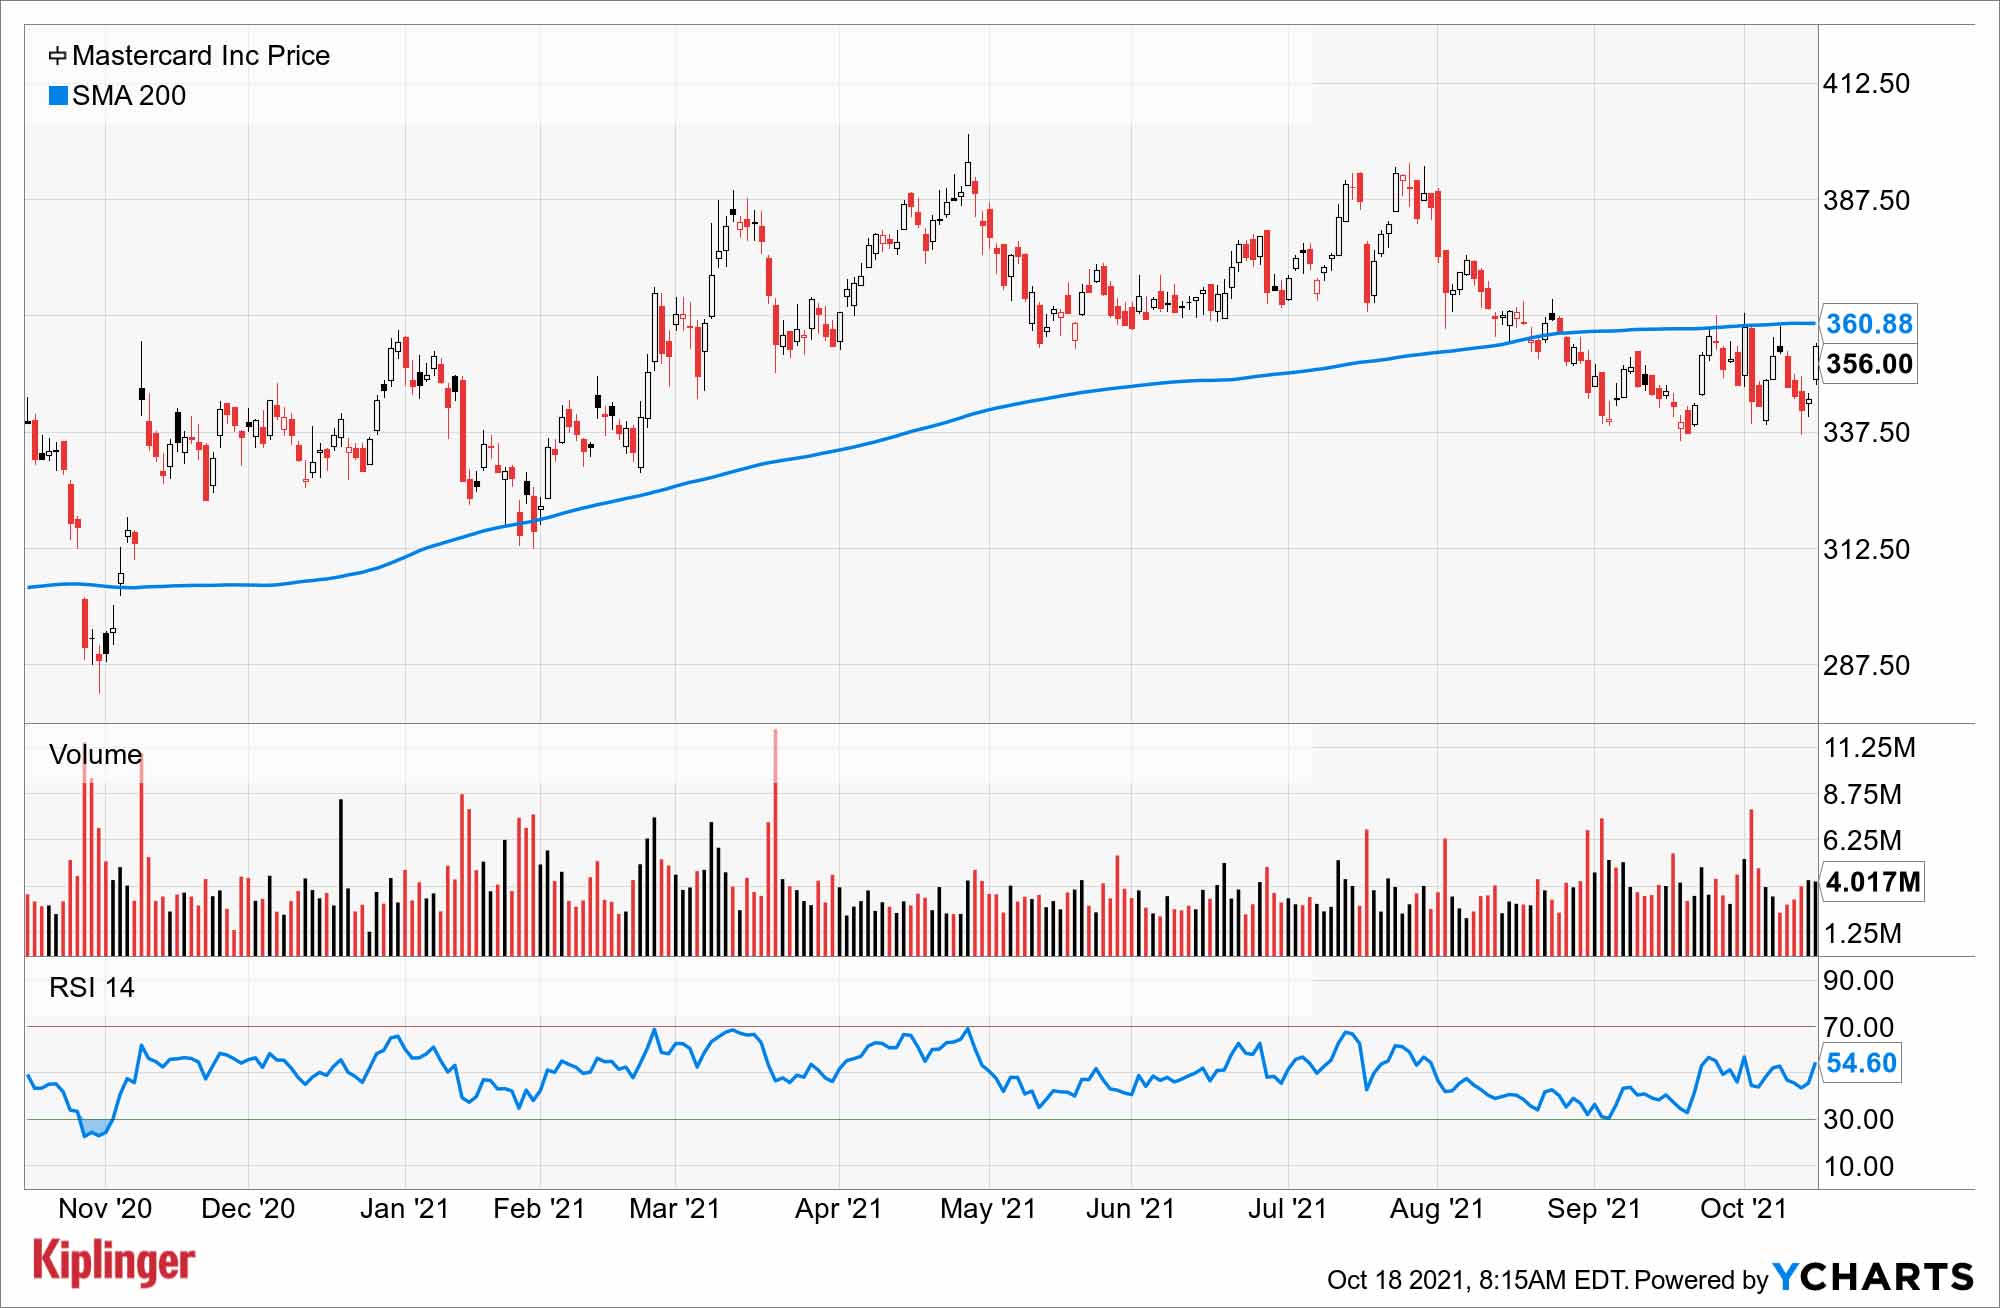
Sales and net income for the second quarter were markedly higher than both the first quarter and the year-ago period, and analysts are optimistic about Mastercard's third-quarter results due out later this month. The pros have issued 27 positive earnings revisions over the past three months, versus just three downward revisions.
There's not much indicating that this weakness should linger. Delta-variant disruptions perhaps put a damper in MA's share-price recovery. And to be fair, Mastercard has levered up a bit since 2020, adding more than $500 million in long-term debt – bringing the total to more than $13 billion.
But Mastercard is a grower, increasing earnings, sales and dividends by 16%, 10% and 40%, respectively over the last decade. While the pandemic has been a hurdle for MA's business in the short-term, in another couple years, we might look back at it like a tiny blip on the screen.
Illumina
- Market value: $64.2 billion
- 200-day moving average: $433.41
Shares of genetic screening company Illumina (ILMN, $409.93) have taken a hit as the Federal Trade Commission intensifies its effort to derail the company's planned $8 billion acquisition of GRAIL, whose tests can detect as many as 50 types of cancer. The uncertainty in ILMN shares has driven them below their 200-day moving average.
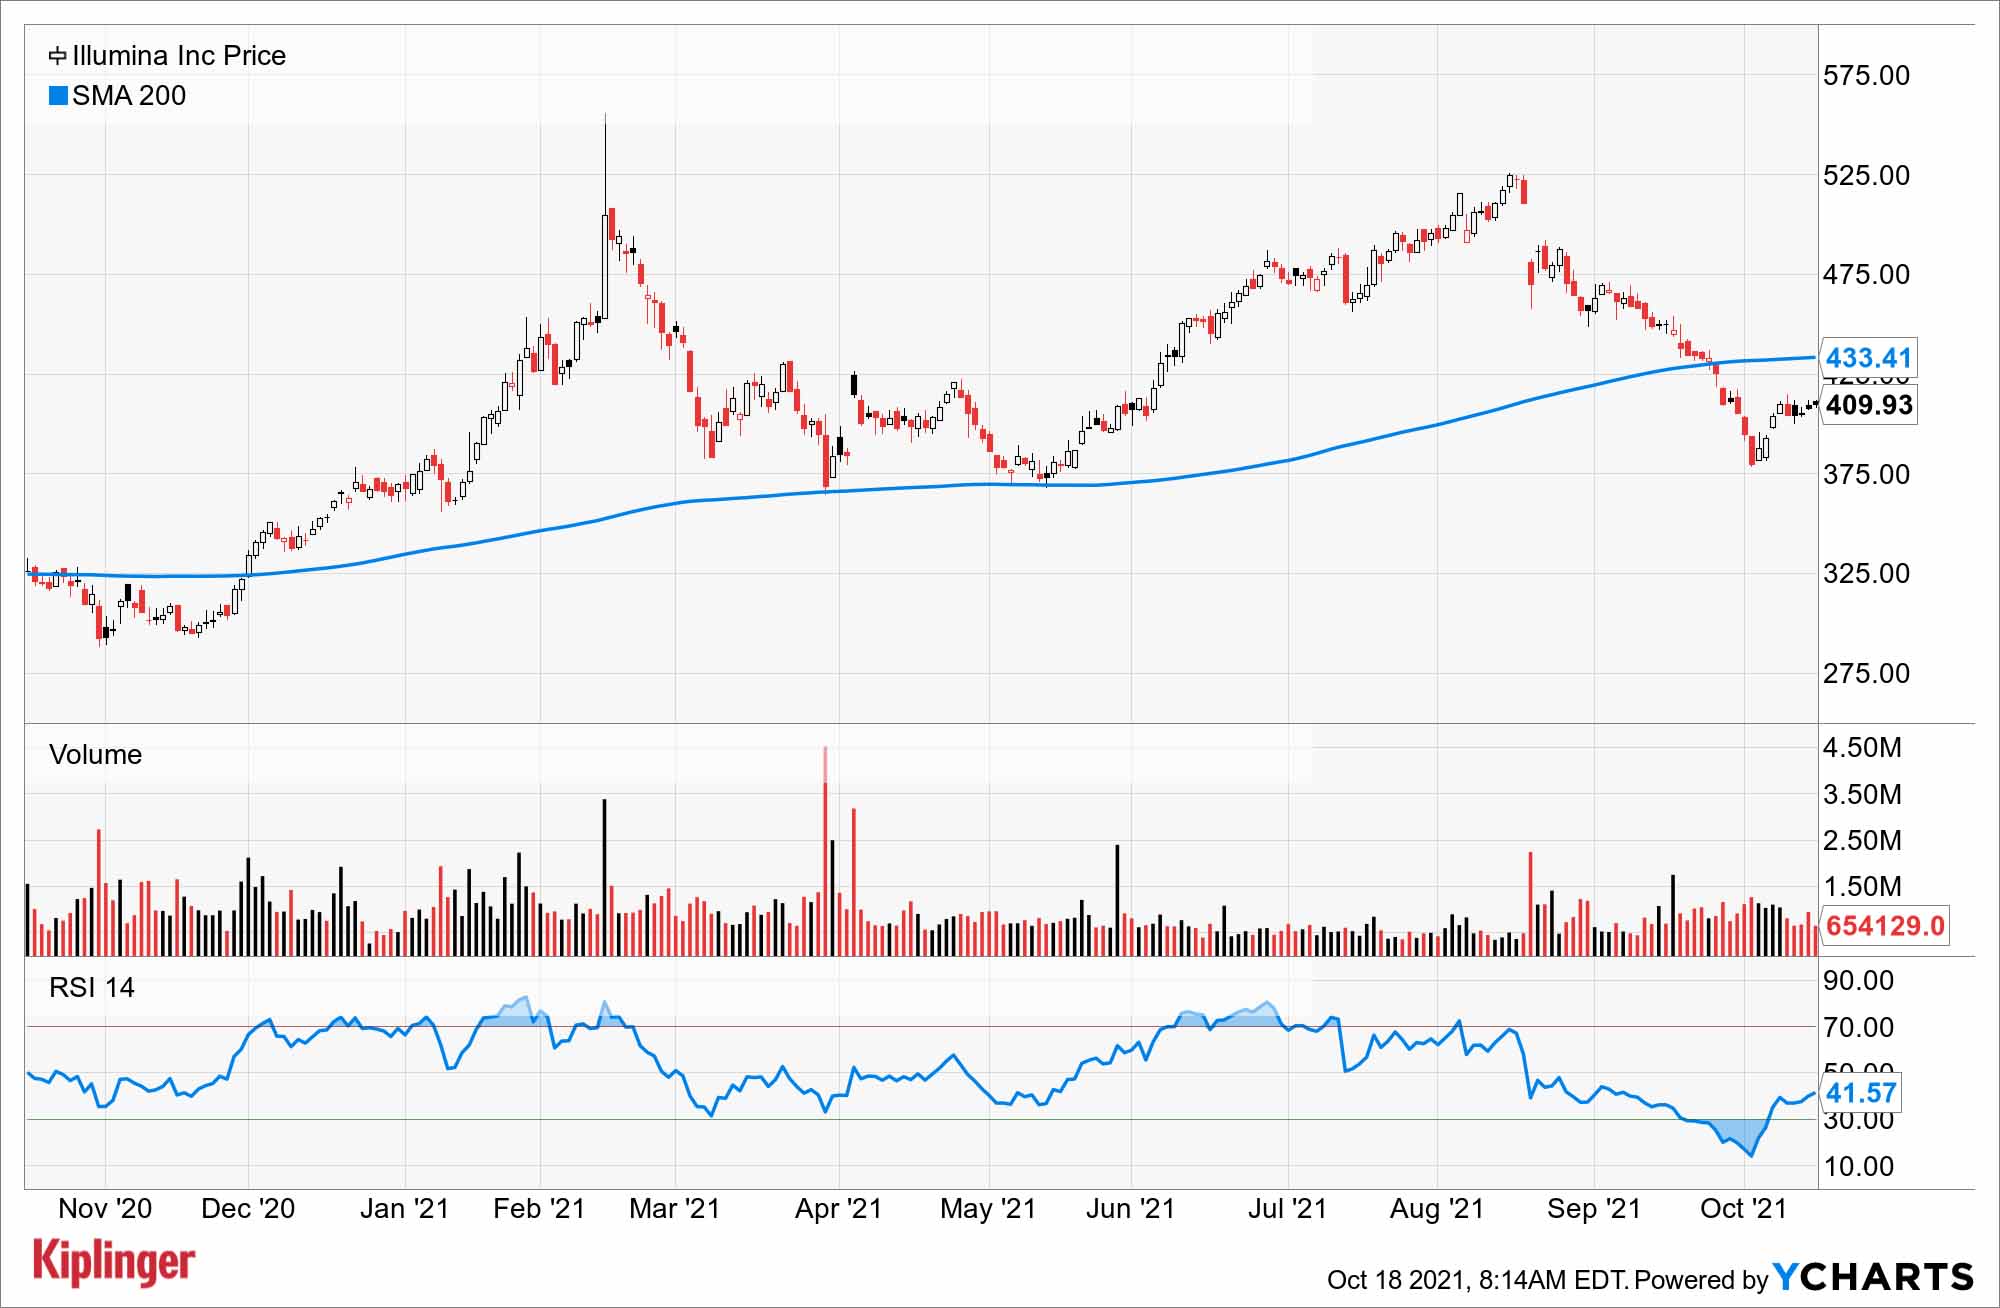
Illumina has grown its earnings, on average, by nearly 24% annually for the past decade, though pandemic-related disruptions weighed on earnings in 2020. So, GRAIL acquisition or not, the company is poised for long-term growth as pharmaceutical companies and health care providers increasingly rely on the company's genetic analysis and screening tools.
Genetic screening is a relatively new market. The first sequencing of the human genome took 13 years and cost nearly $300 million. Now it can be done in a day for less than $1,000, creating new applications and new markets for companies like Illumina. While the torrid growth of the last decade might cool, some analysts see double-digit growth for the balance of the decade. Moreover, Illumina is sporting a strong balance sheet. It's sitting on more than $4.6 billion in cash, and short-term debt coming due is about 10% of that.
The Federal Trade Commission headlines have made some investors nervous, but a look at the underlying trends in genetic screening trends suggest the shares' position below its 200-day moving average might nonetheless be temporary.
Profit and prosper with the best of Kiplinger's advice on investing, taxes, retirement, personal finance and much more. Delivered daily. Enter your email in the box and click Sign Me Up.

-
 Dow Leads in Mixed Session on Amgen Earnings: Stock Market Today
The rest of Wall Street struggled as Advanced Micro Devices earnings caused a chip-stock sell-off.
-
 How to Watch the 2026 Winter Olympics Without Overpaying
Here’s how to stream the 2026 Winter Olympics live, including low-cost viewing options, Peacock access and ways to catch your favorite athletes and events from anywhere.
-
 Here’s How to Stream the Super Bowl for Less
We'll show you the least expensive ways to stream football's biggest event.
-
 If You'd Put $1,000 Into AMD Stock 20 Years Ago, Here's What You'd Have Today
Advanced Micro Devices stock is soaring thanks to AI, but as a buy-and-hold bet, it's been a market laggard.
-
 If You'd Put $1,000 Into UPS Stock 20 Years Ago, Here's What You'd Have Today
United Parcel Service stock has been a massive long-term laggard.
-
 Visa Stamps the Dow's 398-Point Slide: Stock Market Today
It's as clear as ever that President Donald Trump and his administration can't (or won't) keep their hands off financial markets.
-
 If You'd Put $1,000 Into Lowe's Stock 20 Years Ago, Here's What You'd Have Today
Lowe's stock has delivered disappointing returns recently, but it's been a great holding for truly patient investors.
-
 If You'd Put $1,000 Into 3M Stock 20 Years Ago, Here's What You'd Have Today
MMM stock has been a pit of despair for truly long-term shareholders.
-
 If You'd Put $1,000 Into Coca-Cola Stock 20 Years Ago, Here's What You'd Have Today
Even with its reliable dividend growth and generous stock buybacks, Coca-Cola has underperformed the broad market in the long term.
-
 If You Put $1,000 into Qualcomm Stock 20 Years Ago, Here's What You Would Have Today
Qualcomm stock has been a big disappointment for truly long-term investors.
-
 If You'd Put $1,000 Into Home Depot Stock 20 Years Ago, Here's What You'd Have Today
Home Depot stock has been a buy-and-hold banger for truly long-term investors.