5 Market Indicators to Watch (And What They Mean)
Every investor looks for an edge when putting their money to work in the financial markets.

Profit and prosper with the best of Kiplinger's advice on investing, taxes, retirement, personal finance and much more. Delivered daily. Enter your email in the box and click Sign Me Up.
You are now subscribed
Your newsletter sign-up was successful
Want to add more newsletters?

Delivered daily
Kiplinger Today
Profit and prosper with the best of Kiplinger's advice on investing, taxes, retirement, personal finance and much more delivered daily. Smart money moves start here.

Sent five days a week
Kiplinger A Step Ahead
Get practical help to make better financial decisions in your everyday life, from spending to savings on top deals.

Delivered daily
Kiplinger Closing Bell
Get today's biggest financial and investing headlines delivered to your inbox every day the U.S. stock market is open.

Sent twice a week
Kiplinger Adviser Intel
Financial pros across the country share best practices and fresh tactics to preserve and grow your wealth.

Delivered weekly
Kiplinger Tax Tips
Trim your federal and state tax bills with practical tax-planning and tax-cutting strategies.

Sent twice a week
Kiplinger Retirement Tips
Your twice-a-week guide to planning and enjoying a financially secure and richly rewarding retirement

Sent bimonthly.
Kiplinger Adviser Angle
Insights for advisers, wealth managers and other financial professionals.

Sent twice a week
Kiplinger Investing Weekly
Your twice-a-week roundup of promising stocks, funds, companies and industries you should consider, ones you should avoid, and why.

Sent weekly for six weeks
Kiplinger Invest for Retirement
Your step-by-step six-part series on how to invest for retirement, from devising a successful strategy to exactly which investments to choose.
Every investor looks for an edge when putting their money to work in the financial markets. Most rely on company information such as earnings and sales to decide if a company is in good shape and its stock is likely to increase in value. Several metrics, such as the price-to-earnings ratio (P/E), are widely followed.
But everyone sees that information, so there is little edge to be had. Even more problematic: Much of the data upon which investors rely is derived by Wall Street analysts, filtered through their own expertise and bias. How can anyone know for sure what a company will earn next year, let alone five years from now?
Investors should consider a few other market indicators that aren’t so familiar. These do not rely on educated guesses as to what will happen in the future; rather, they come straight from the market itself. They encapsulate the market’s outlook for capital appreciation. And they can give us an idea about how the market feels about things.
Put differently: They can help us tap into the market’s mood.
There is nothing wrong with getting a handle on next year’s business and economic prospects. It’s also a good idea to get an expert’s take on how new tax legislation and geopolitical events could impact a company’s fortunes. But these five market indicators let you know not just what Wall Street thinks, but what the market thinks, giving you a complete picture to build your strategy around.
The Advance-Decline Line
We call it the stock market, but really, it is a market of stocks. Every stock has its own story and not all of those stories are good. However, when a healthy percentage of them are indeed positive, we consider the market as a whole to be on a good footing and more likely to remain strong.
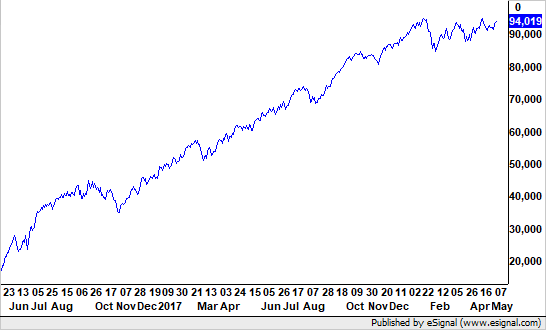
Each day, keepers of the data count how many stocks go up in price and how many go down on each stock exchange with most of the focus on the New York Stock Exchange. They then simply subtract the decliners from the advancers to get the net advance-decline value for the day.
One day’s worth of data is not that telling, but when we look at the data over time, adding each day to a running (or cumulative) total, we can see if more stocks are consistently going up than going down. Obviously, we want that cumulative value to increase to show a healthy market.
A rising advance-decline line tells us that the “soldiers” (the majority of stocks) are following the “generals” (the leaders) into battle. When major stock indexes move higher and the advance-decline line moves lower, it tells us that the soldiers are not following. The market usually cannot sustain its advance for long in this situation.
With all the focus these days on the big technology stocks, and how dominant they are, it is quite reassuring that the New York Stock Exchange’s advance-decline line remains in a rising trend and near all-time highs.
Small-Cap/Large-Cap Ratio
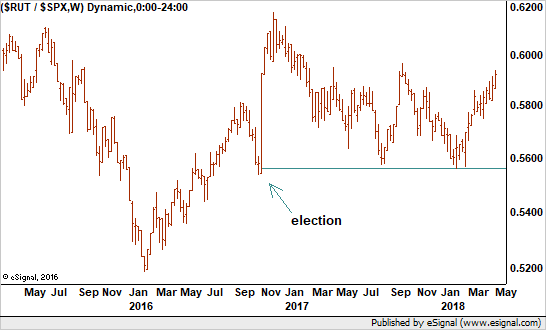
Similar to the advance-decline line, a healthy stock market usually sees strong participation by smaller stocks. We can apply the same analogy of the generals and soldiers here, too. The generals, in this case, would be the large stocks in the Standard & Poor’s 500-stock index. The soldiers are the smaller stocks in the Russell 2000 index.
A rising small-stock-to-big-stock ratio also signifies that the market has a more aggressive attitude toward taking risks. A falling ratio could mean investors want to avoid risk and seek shelter in safer blue chips.
This ratio also provides encouragement as a broad array of stocks moves higher, even though giant stocks such as Amazon.com (AMZN) get all the headlines – and credit – for keeping the market afloat. The small-cap-to-large-cap ratio says otherwise, and that is a positive message.
Copper/Gold Ratio
This ratio is a spin on fundamental concepts such as input prices and cash reserves. Copper is an industrial metal with uses in a variety of places in the economy. It is critical for housing as copper pipes and wiring. It is critical in electronics. And combined with other metals it makes brass and bronze.
In fact, it is so important that pundits have issued the metal an honorary Ph.D in economics: “Dr. Copper.”
Gold, on the other hand, is most prized as a store of value and a hedge against inflation and weak currencies. In other words, investors hold gold when they want to preserve their wealth, not grow it.
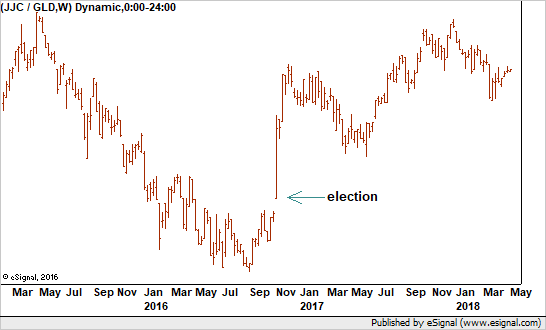
A rising copper-to-gold ratio suggests the economy demands more copper and is less concerned with hedging. Another term for all that is confidence. And a confident economy means there is business – and profits – to spread around to more companies. That, in turn, is good for stocks.
Junk Bond Ratio
Corporate bonds with low credit ratings are called high-yield bonds, because they have higher yields than investment grade bonds. And they are called junk bonds because they are often so speculative that the risk of missing an interest payment or even paying back principal value is substantial.
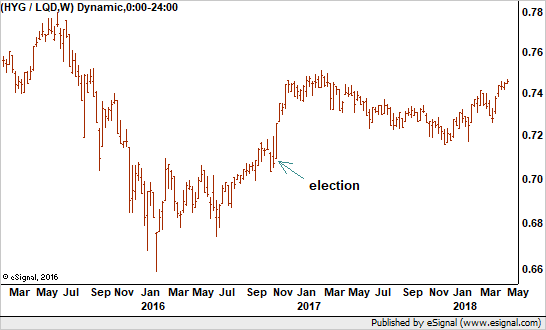
Junk bonds are the ultimate measure of how investors feel about taking risk. Therefore, when the ratio of junk bond indexes to higher-quality corporate bond indexes rises, we know that investors are aggressive. They have money to put to work and need places to do it.
When the ratio falls, it tells us that investors are less interested in taking excessive risks. The mood of the financial markets is dour, and that usually does not bode well for both stocks and bonds.
Right now, the ratio is on the rise. Interestingly, the ratio got a strong boost after the election in 2016 but spent the majority of 2017 in decline. We can speculate that the political climate had a lot to do with that, but now it is heading back up. That suggests confidence.
Emerging Markets vs. U.S.
The performance of emerging markets, which are more speculative, also gives us an idea about how the global stock market feels. When money flows overseas to developing markets, we surmise that investors feel confident to take those higher risks.
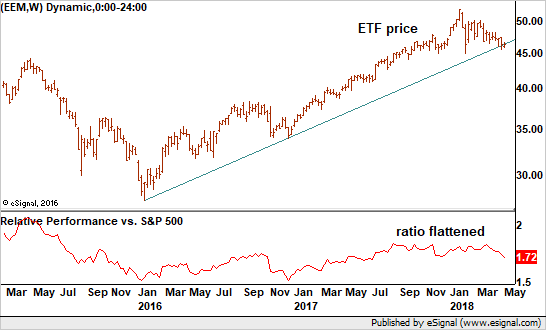
Therefore, a rising ratio means investors think there is greater potential in riskier markets. They are willing to chase higher returns and the global mood gets more positive.
While the long-term trend of emerging markets indices remains in a rising trend since the global rally took hold in early 2016, its short-term condition is not as sanguine as the S&P 500 itself. And the ratio of the two, which got a boost after the election, leveled off.
This tells us that not everything looks rosy for global stocks right now. It is not enough by itself to say the stock market rally is over, but it does serve as a warning to pay closer attention to changes in other ratios.
Profit and prosper with the best of Kiplinger's advice on investing, taxes, retirement, personal finance and much more. Delivered daily. Enter your email in the box and click Sign Me Up.

-
 Look Out for These Gold Bar Scams as Prices Surge
Fraudsters impersonating government agents are convincing victims to convert savings into gold — and handing it over in courier scams costing Americans millions.
-
 How to Turn Your 401(k) Into A Real Estate Empire
Tapping your 401(k) to purchase investment properties is risky, but it could deliver valuable rental income in your golden years.
-
 My First $1 Million: Retired Nuclear Plant Supervisor, 68
Ever wonder how someone who's made a million dollars or more did it? Kiplinger's My First $1 Million series uncovers the answers.
-
 Dow Adds 1,206 Points to Top 50,000: Stock Market Today
The S&P 500 and Nasdaq also had strong finishes to a volatile week, with beaten-down tech stocks outperforming.
-
 Nasdaq Slides 1.4% on Big Tech Questions: Stock Market Today
Palantir Technologies proves at least one publicly traded company can spend a lot of money on AI and make a lot of money on AI.
-
 Dow Rises 313 Points to Begin a Big Week: Stock Market Today
The S&P 500 is within 50 points of crossing 7,000 for the first time, and Papa Dow is lurking just below its own new all-time high.
-
 Nasdaq Leads Ahead of Big Tech Earnings: Stock Market Today
President Donald Trump is making markets move based on personal and political as well as financial and economic priorities.
-
 11 Stock Picks Beyond the Magnificent 7
With my Mag-7-Plus strategy, you can own the mega caps individually or in ETFs and add in some smaller tech stocks to benefit from AI and other innovations.
-
 Dow Dives 870 Points on Overseas Affairs: Stock Market Today
Fiscal policy in the Far East and foreign policy in the near west send markets all over the world into a selling frenzy.
-
 Stocks Struggle for Gains to Start 2026: Stock Market Today
It's not quite the end of the world as we know it, but Warren Buffett is no longer the CEO of Berkshire Hathaway.
-
 Stocks Extend Losing Streak After Fed Minutes: Stock Market Today
The Santa Claus Rally is officially at risk after the S&P 500's third straight loss.
