How Presidential Elections Affect the Stock Market
Myths abound, but when it comes to your portfolio, it's not as simple as which party wins the White House.

Profit and prosper with the best of Kiplinger's advice on investing, taxes, retirement, personal finance and much more. Delivered daily. Enter your email in the box and click Sign Me Up.
You are now subscribed
Your newsletter sign-up was successful
Want to add more newsletters?

Delivered daily
Kiplinger Today
Profit and prosper with the best of Kiplinger's advice on investing, taxes, retirement, personal finance and much more delivered daily. Smart money moves start here.

Sent five days a week
Kiplinger A Step Ahead
Get practical help to make better financial decisions in your everyday life, from spending to savings on top deals.

Delivered daily
Kiplinger Closing Bell
Get today's biggest financial and investing headlines delivered to your inbox every day the U.S. stock market is open.

Sent twice a week
Kiplinger Adviser Intel
Financial pros across the country share best practices and fresh tactics to preserve and grow your wealth.

Delivered weekly
Kiplinger Tax Tips
Trim your federal and state tax bills with practical tax-planning and tax-cutting strategies.

Sent twice a week
Kiplinger Retirement Tips
Your twice-a-week guide to planning and enjoying a financially secure and richly rewarding retirement

Sent bimonthly.
Kiplinger Adviser Angle
Insights for advisers, wealth managers and other financial professionals.

Sent twice a week
Kiplinger Investing Weekly
Your twice-a-week roundup of promising stocks, funds, companies and industries you should consider, ones you should avoid, and why.

Sent weekly for six weeks
Kiplinger Invest for Retirement
Your step-by-step six-part series on how to invest for retirement, from devising a successful strategy to exactly which investments to choose.
Every four years, politics and finance converge as Americans elect a president and investors try to figure out what the outcome means for their portfolios.
A look back at history shows that presidential election cycles indeed correlate with stock market returns – although not in the same, clockwork way that, say, the moon pulls on tides.
As for the outcome of elections? The impact might surprise you.
From just $107.88 $24.99 for Kiplinger Personal Finance
Become a smarter, better informed investor. Subscribe from just $107.88 $24.99, plus get up to 4 Special Issues

Sign up for Kiplinger’s Free Newsletters
Profit and prosper with the best of expert advice on investing, taxes, retirement, personal finance and more - straight to your e-mail.
Profit and prosper with the best of expert advice - straight to your e-mail.
Below, a few things investors should consider in election years.
The Presidential Cycle
Wars, bear markets and recessions tend to start in the first two years of a president's term, says The Stock Trader's Almanac; bull markets and prosperous times mark the latter half. But over the past century, the stock market has mostly run briskly across most of the presidential cycle before losing momentum during election years.
Since 1930, the Dow Jones Industrial Average has gained an average of 10.0% in a president's first year and 7.9% in the second, according to YCharts data. (Returns are based on price only and exclude dividends.) The year before an election year is historically the strongest, at 13.3% returns, then things slow down considerably, to 5.4% returns in election years.
There are exceptions, of course. In George Bush's final year of service (January 2008 through January 2009), for instance, the Dow sank nearly 32%.
But no one needs to tell you that the current cycle is anything but average. The Dow Jones Industrial Average put together 32.1% returns during the first 365 days President Donald Trump was in office, followed by a 5.2% decline in his second year, and an 18.8% rebound in his third. And between Jan. 19 and Oct. 19 of 2020, stocks have lost 2.5%, using the DJIA as a proxy.
Democrat or Republican?
You might feel strongly about one party or the other when it comes to your politics, but when it comes to your portfolio, it doesn't matter much which party wins the White House.
Bespoke Research shows that since 1900, the Dow Jones Industrial Average has gained 4.8% annually. Conventional wisdom might suggest that Republicans, who are supposedly more business-friendly than the Democrats, would be more beneficial for your stock holdings. However, that's not quite the case.
"When we do see a political influence, it is not what might be expected," writes Brad McMillan, chief investment officer for Commonwealth Financial Network. "The average Republican administration over that time period saw gains of 3.5% per year, while the Democrats saw gains of almost twice as much, at 6.7% per year."
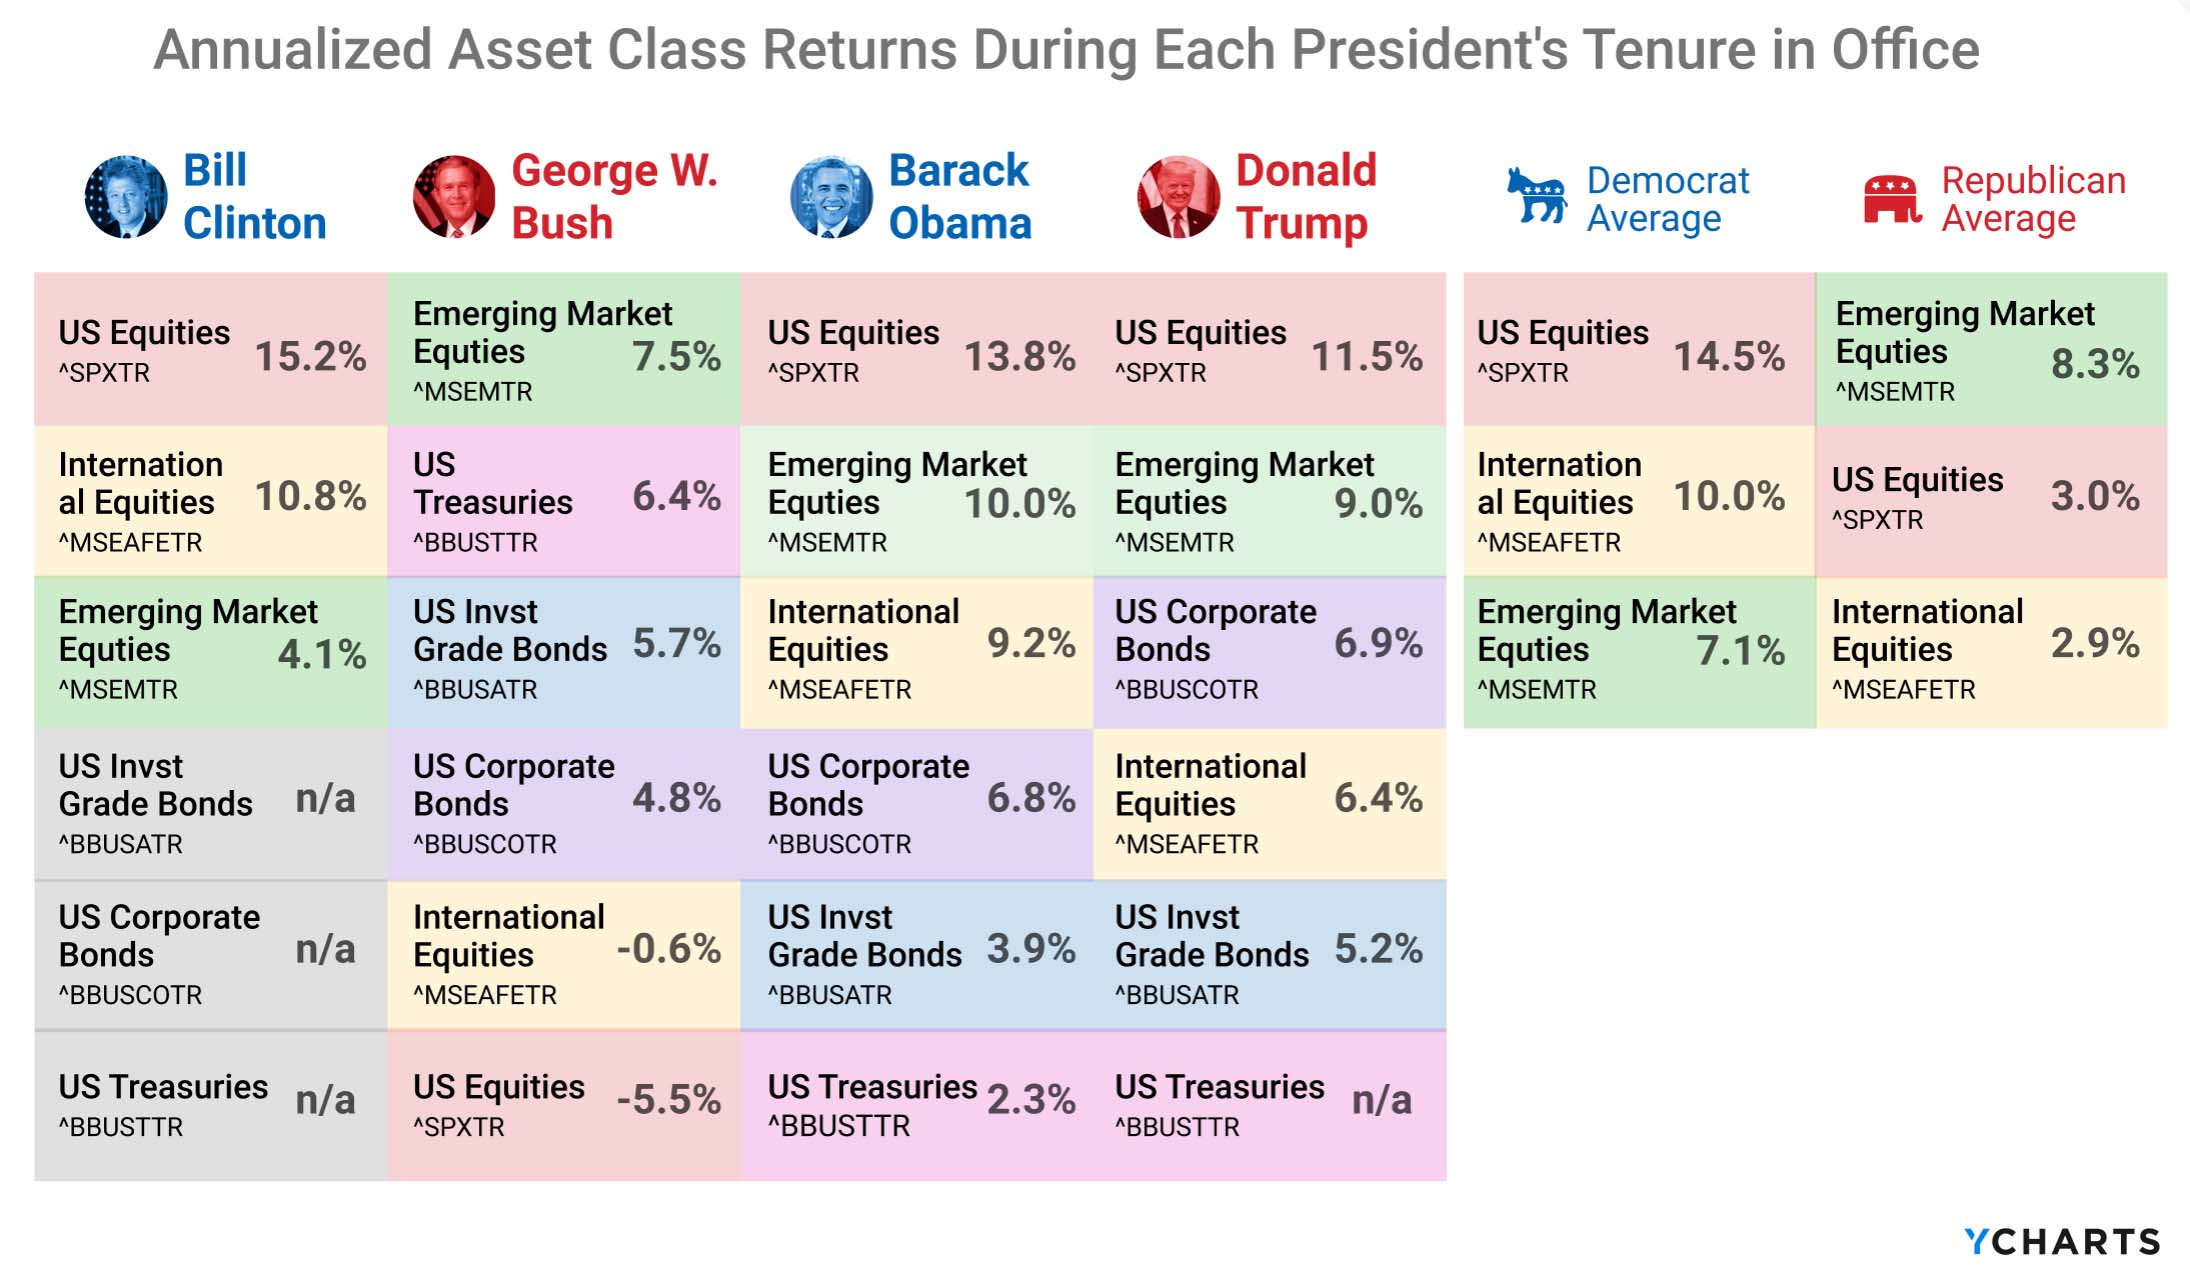
This trend is even more pronounced in recent decades. Since Bill Clinton's inauguration in 1993, U.S. equities have grown 14.5% on average while Democrats control the White House, according to YCharts data, against just 3% under Republican control. But clearly, American stocks have also done well under Trump.
Interestingly, international equities also outperform under Democrats, though emerging-markets stocks have the edge under GOP presidents.
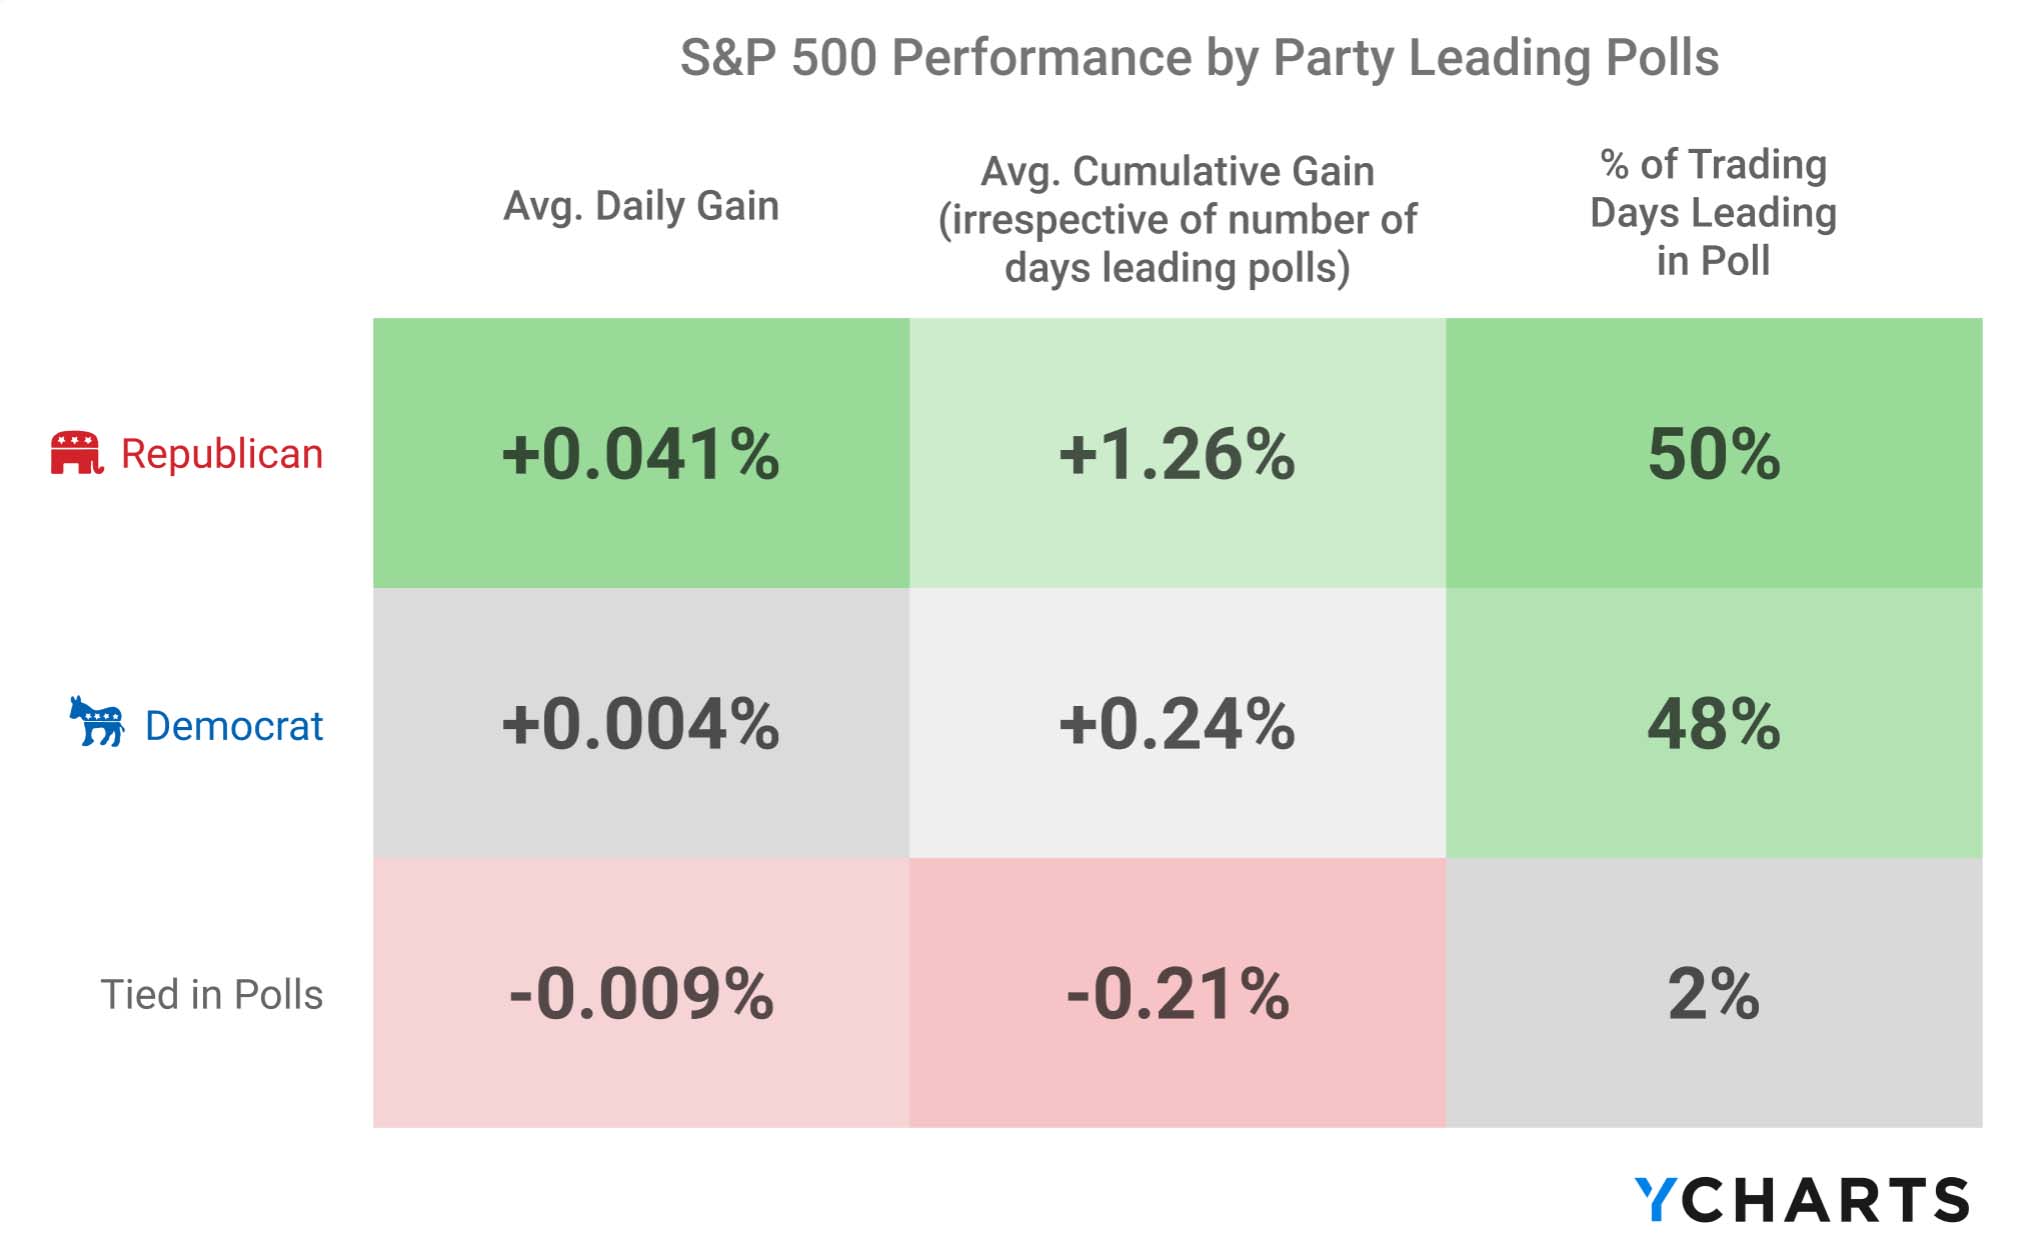
However, stocks do better in the lead-up to elections when America is signaling a Republican presidential win.
Jim Stack, a market historian and publisher of the newsletter InvesTech Research, also says to tune out headlines predicting doomsday for the markets.
"Today, many are warning of how a Biden presidency might negatively impact the stock market or the economy," he says, but adds there were similar warnings about Trump in the previous election cycle. "While investors should not ignore politics, it is worth noting that market results are rarely as dire as portrayed by the headlines."
Divided vs. United Government
Another urban legend is that markets do better when government is divided, says Russ Koesterich, chief investment strategist at BlackRock. The theory behind the legend, he says, is that "divided power saves both parties from their worst instincts. With neither party in control, government is somewhat neutered, leaving markets free to flourish."
But the theory isn't borne out by history.
YCharts has looked at stock returns going back to 1930 under three separate scenarios. When one party controls the White House and both houses of Congress, the Dow averages 10.7% annual returns. When there's a split Congress, stocks average 9.1% returns. But when the president is in the party opposite of both the House and Senate, stocks deliver a mere 7% average annual return.
But even then, those scenarios have played out differently depending on which party ruled which part of Washington. Consider this breakdown of scenario by party, using S&P 500 data from RBC Capital Markets data going back to 1933:
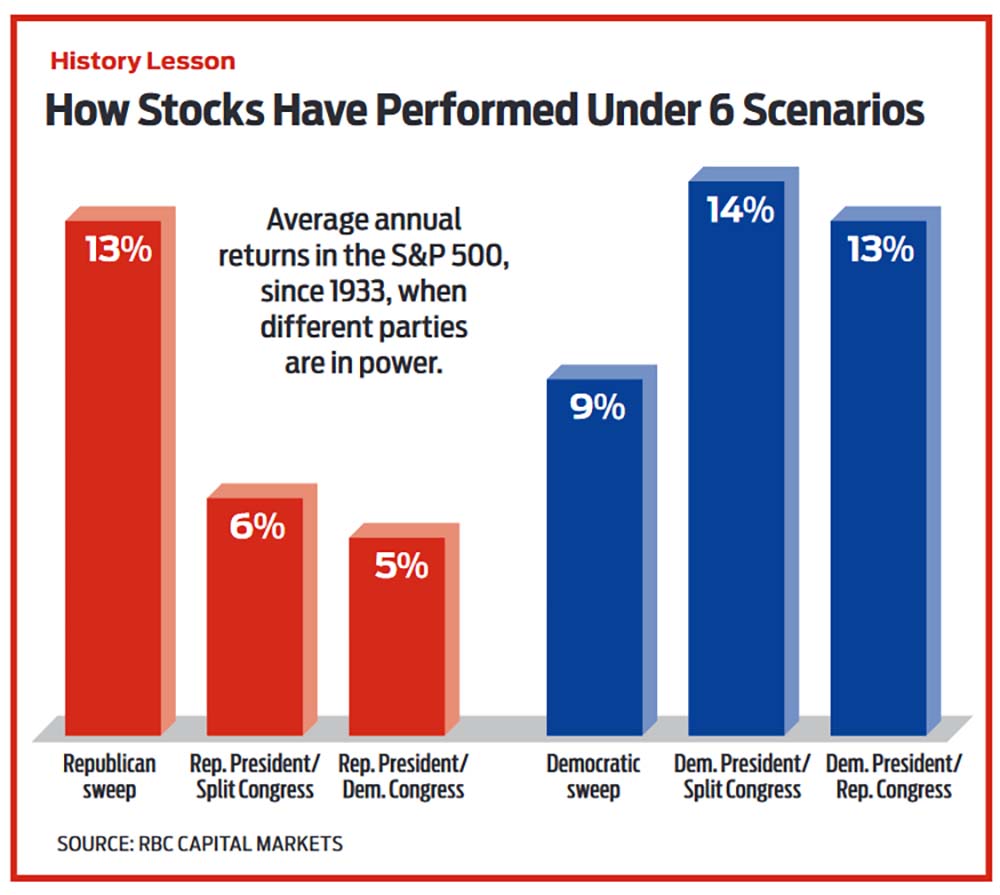
Important to remember is that all of this information is looking at the performance of the broader stock market. Presidential elections can and will continue to have more specific consequences for the market's various sectors and indices, depending on each party's agenda and how much of Washington they control.
The idea of "Trump stocks" and "Biden stocks" remains very real.
A Political Crystal Ball
Election results might not be so great at predicting stock market returns, but the converse is not the case.
It turns out that the stock market has an uncanny ability to predict who will call the White House home for the next four years. If the stock market is up in the three months leading up to the election, put your money on the incumbent party. Losses over those three months tend to usher in a new party.
The statistics are compelling. In the 23 president elections since 1928, 14 were preceded by gains in the three months prior. In 12 of those 14 instances, the incumbent (or the incumbent party) won the White House. In eight of nine elections preceded by three months of stock market losses, incumbents were sent packing. That's an 87% accuracy rate. (Exceptions to this correlation occurred in 1956, 1968 and 1980.)
The number to watch this year: 3,295. If the S&P 500 dips (and stays) below that number, it will be bad news for Trump, according to this presidential predictor indicator.
Profit and prosper with the best of Kiplinger's advice on investing, taxes, retirement, personal finance and much more. Delivered daily. Enter your email in the box and click Sign Me Up.

Anne Kates Smith brings Wall Street to Main Street, with decades of experience covering investments and personal finance for real people trying to navigate fast-changing markets, preserve financial security or plan for the future. She oversees the magazine's investing coverage, authors Kiplinger’s biannual stock-market outlooks and writes the "Your Mind and Your Money" column, a take on behavioral finance and how investors can get out of their own way. Smith began her journalism career as a writer and columnist for USA Today. Prior to joining Kiplinger, she was a senior editor at U.S. News & World Report and a contributing columnist for TheStreet. Smith is a graduate of St. John's College in Annapolis, Md., the third-oldest college in America.
-
 Dow Adds 1,206 Points to Top 50,000: Stock Market Today
The S&P 500 and Nasdaq also had strong finishes to a volatile week, with beaten-down tech stocks outperforming.
-
 Ask the Tax Editor: Federal Income Tax Deductions
Ask the Editor In this week's Ask the Editor Q&A, Joy Taylor answers questions on federal income tax deductions
-
 States With No-Fault Car Insurance Laws (and How No-Fault Car Insurance Works)
A breakdown of the confusing rules around no-fault car insurance in every state where it exists.
-
 Dow Adds 1,206 Points to Top 50,000: Stock Market Today
The S&P 500 and Nasdaq also had strong finishes to a volatile week, with beaten-down tech stocks outperforming.
-
 Stocks Sink With Alphabet, Bitcoin: Stock Market Today
A dismal round of jobs data did little to lift sentiment on Thursday.
-
 Dow Leads in Mixed Session on Amgen Earnings: Stock Market Today
The rest of Wall Street struggled as Advanced Micro Devices earnings caused a chip-stock sell-off.
-
 Nasdaq Slides 1.4% on Big Tech Questions: Stock Market Today
Palantir Technologies proves at least one publicly traded company can spend a lot of money on AI and make a lot of money on AI.
-
 Fed Vibes Lift Stocks, Dow Up 515 Points: Stock Market Today
Incoming economic data, including the January jobs report, has been delayed again by another federal government shutdown.
-
 Stocks Close Down as Gold, Silver Spiral: Stock Market Today
A "long-overdue correction" temporarily halted a massive rally in gold and silver, while the Dow took a hit from negative reactions to blue-chip earnings.
-
 If You'd Put $1,000 Into AMD Stock 20 Years Ago, Here's What You'd Have Today
Advanced Micro Devices stock is soaring thanks to AI, but as a buy-and-hold bet, it's been a market laggard.
-
 Nasdaq Drops 172 Points on MSFT AI Spend: Stock Market Today
Microsoft, Meta Platforms and a mid-cap energy stock have a lot to say about the state of the AI revolution today.

