Is Investing In Gold Worth It? How Gold Prices Have Changed
Gold can do well in times of trouble but its long-term record isn't so lustrous.


Profit and prosper with the best of Kiplinger's advice on investing, taxes, retirement, personal finance and much more. Delivered daily. Enter your email in the box and click Sign Me Up.
You are now subscribed
Your newsletter sign-up was successful
Want to add more newsletters?

Delivered daily
Kiplinger Today
Profit and prosper with the best of Kiplinger's advice on investing, taxes, retirement, personal finance and much more delivered daily. Smart money moves start here.

Sent five days a week
Kiplinger A Step Ahead
Get practical help to make better financial decisions in your everyday life, from spending to savings on top deals.

Delivered daily
Kiplinger Closing Bell
Get today's biggest financial and investing headlines delivered to your inbox every day the U.S. stock market is open.

Sent twice a week
Kiplinger Adviser Intel
Financial pros across the country share best practices and fresh tactics to preserve and grow your wealth.

Delivered weekly
Kiplinger Tax Tips
Trim your federal and state tax bills with practical tax-planning and tax-cutting strategies.

Sent twice a week
Kiplinger Retirement Tips
Your twice-a-week guide to planning and enjoying a financially secure and richly rewarding retirement

Sent bimonthly.
Kiplinger Adviser Angle
Insights for advisers, wealth managers and other financial professionals.

Sent twice a week
Kiplinger Investing Weekly
Your twice-a-week roundup of promising stocks, funds, companies and industries you should consider, ones you should avoid, and why.

Sent weekly for six weeks
Kiplinger Invest for Retirement
Your step-by-step six-part series on how to invest for retirement, from devising a successful strategy to exactly which investments to choose.
Gold prices might be at record highs, but ask any veteran goldbug about investing in the precious metal and they'll likely caution you that it will too often break your heart.
True, investing in gold tends to work in times of trouble. For example, gold prices vaulted past $2,000 an ounce in early March 2022 in response to the Russian invasion of Ukraine.
But then that's just the way it goes with gold, experts say.
"If we had to distill the 1970, 1976, 1982, 1985, 2001 and 2018 bull markets in gold down to one driver, the oil crisis, stagflation, rebound trade, Plaza Accord, quantitative easing and COVID, respectively, have been key," writes Michael Widmer, commodity strategist at BofA Securities.
And as for the latest rally in gold? Prices topped $4,000 an ounce largely on trade fears.
"Gold's panic ascent shows that even safe-haven assets are not immune to the volatility unleashed in the confusion of the tariff age," notes Susannah Streeter, head of money and markets at Hargreaves Lansdown. "Gold had been shining as a shelter amid the trade storm, but the bullion market has been blindsided by a specific threat of duties on gold bar imports into the U.S., sending U.S. futures prices soaring to record levels."
Just understand that despite some lustrous returns in the 1970s (thanks to the end of the gold peg), and in the first decade of the 21st century, gold has mostly generated disappointing long-term performance compared to equities.
Between 1971, when convertibility was suspended, to its 1980 peak, gold rose to $840 an ounce from $35, or a compound annual growth rate of more than 40%, notes famed short seller Jim Chanos. Since 1980, however, gold's annualized return comes to just 3%.
Even gold's reputation as an inflation hedge isn't all that great.
Historically, at least, gold returns have only kept up with inflation over the long haul; the metal hasn't outperformed. Over the short and medium term, gold's record as an inflation hedge is generally pretty poor.
To be sure, gold ETFs and gold miner stocks can be effective tools in the hands of traders and tactical investors. But that means knowing when to get in – and when to get out.
As for investing in gold for the long term? Suffice to say a buy-and-hold approach has too often ended in tears.
Just look at recent events. If any year should have been good for gold, it was 2022. U.S. stocks plunged into a bear market, and bonds got killed too. Investors worried incessantly over the odds of recession or possibility of stagflation. Inflation hit levels not seen in four decades.
And what did gold prices ultimately do? They ended the year almost exactly where they started.
Since investing in gold is obviously not easy, here are some critical nuggets you must know before betting on the precious metal.
Data, prices and returns are courtesy of Kitco, DQYDJ, the Perth Mint, the World Gold Council, YCharts, the U.S. Mint and Morningstar.

Over the past 40 years, which investment has performed best?
Gold? Nope. U.S. bonds? Wrong again. Large-cap stocks traded in the U.S. have easily outperformed those asset classes in the past four decades.
From 1984 through 2024, the S&P 500, with dividends reinvested, returned an annualized 11.6% before inflation. Adjusted for inflation, the market's annualized total return came to 8.6%.
As for bonds, the benchmark 10-year Treasury note delivered an annualized total return of 5.1% over the same time frame. Adjusted for inflation, the 10-year note delivered an annualized total return of 2.2%.
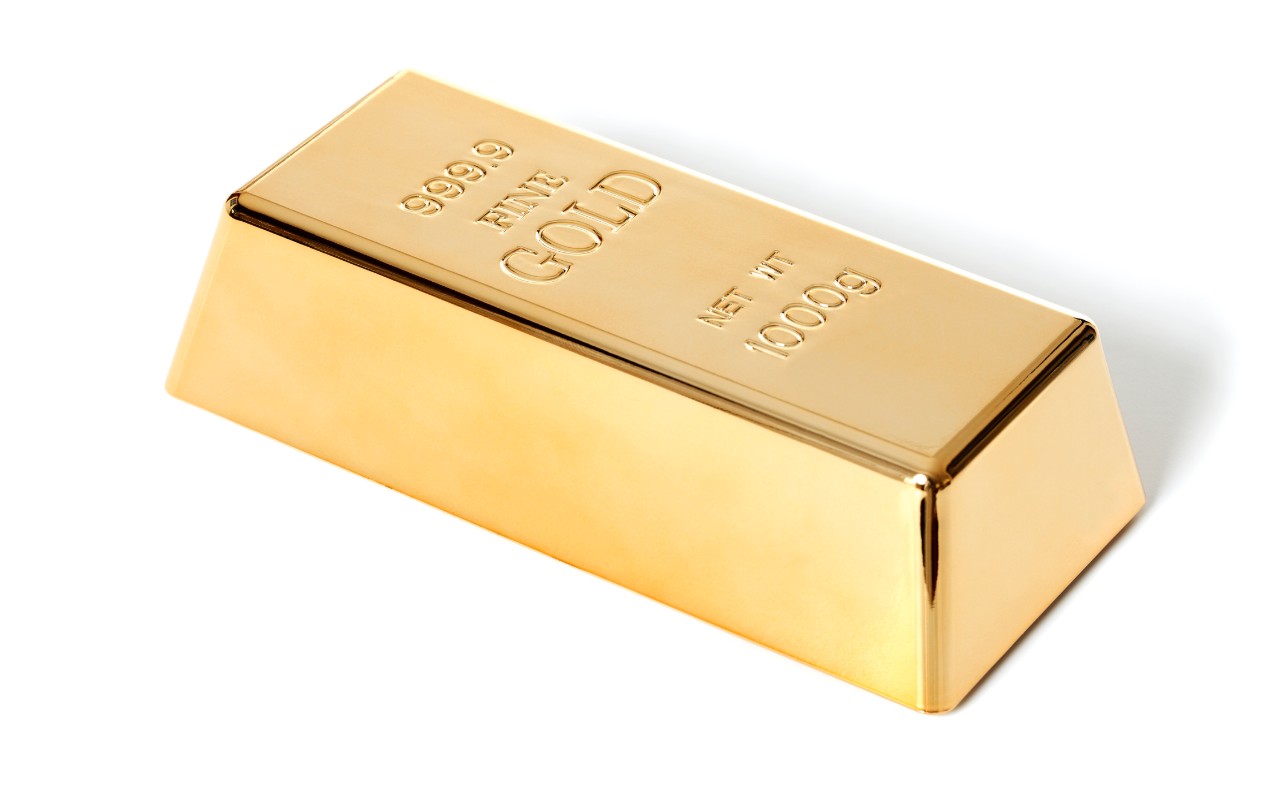
Gold's returns in the same span haven't been quite so brilliant. From 1984 through 2024, the yellow metal generated an annualized return of 4.3% before inflation. After adjusting for inflation, gold produced an annualized return of 1.5%.
Over the past 30 years, which investment has performed best?
Once again, U.S. stocks beat both U.S. bonds and gold.
From 1994 through 2024, the S&P 500 generated an annualized total return (price appreciation plus dividends) of 10.6% before inflation. After inflation, the return came to 7.9%.
The 10-year Treasury note delivered an annualized return of 3.7% in the same span. Adjusted for inflation, 10-year notes delivered an annualized return of 1.2%.
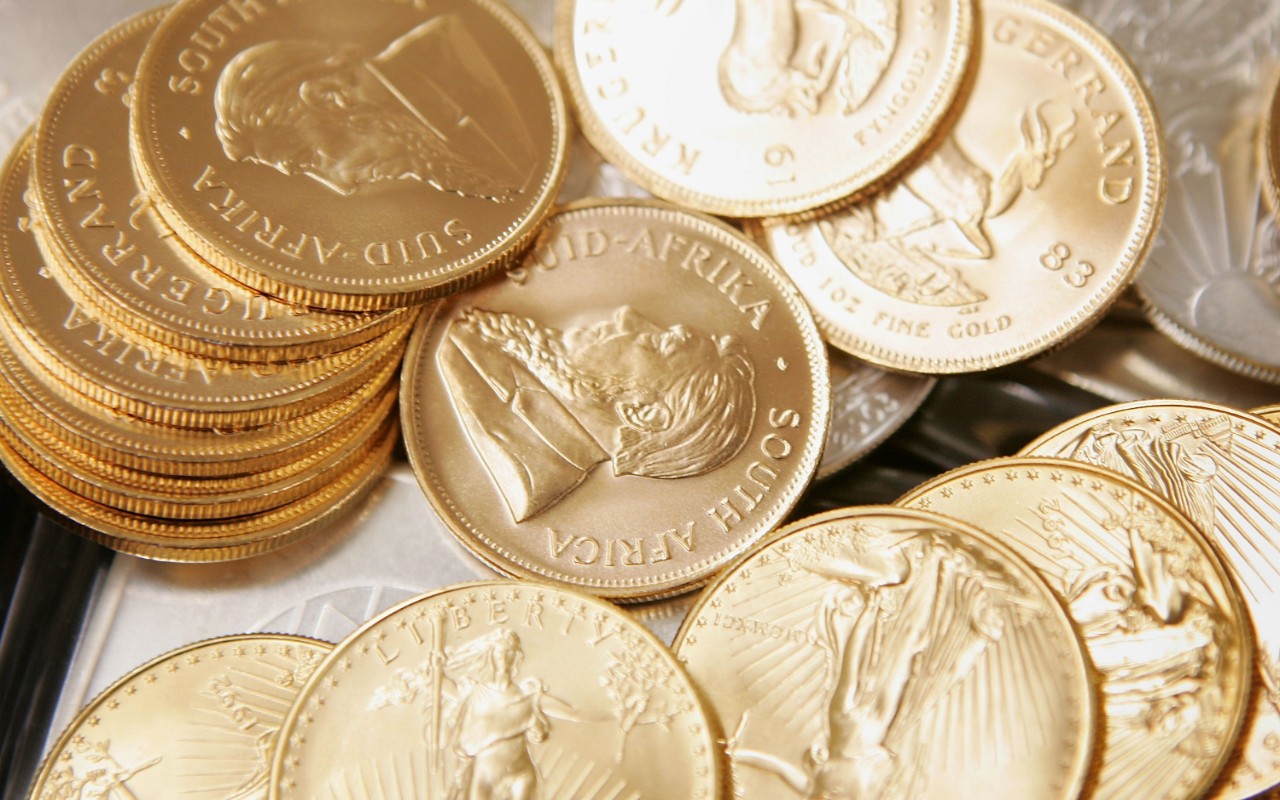
Gold, meanwhile, generated an annualized return of 5.7% before inflation. On an inflation-adjusted basis, gold's annualized return comes to 3.1%.
The yellow metal trailed stocks once again, but outperformed bonds.
Note that the price of gold actually dropped about 27% from 1989 to 1999. Gold often loses value in prosperous times, as the 1990s generally were.
What about in the past 20 years?
The early part of the 21st century was gold's time to shine. From 2004 through 2024, gold generated an annualized return of 8.4%. Adjusted for inflation, that comes to 5.6% annualized.
Stocks still beat gold in that two-decade span, however, with a total return of 10.6% annualized, or 7.8% after factoring in inflation. Don't forget that equities fell victim to the bursting of two bubbles — the tech bubble early in the century and the real estate and credit bubbles starting around 2007.
Benchmark Treasury notes came in last during this period, with a 2.4% annualized return, or -0.2% in inflation-adjusted terms.

Gold isn't the inflation hedge it's cracked up to be
The price of gold doesn't track inflation, as a general rule. From 1987 to 2001, as inflation fluctuated around 3% a year, the price of gold dropped.
It's true that during periods of extraordinarily high inflation, gold’s price could soar.
That’s what happened from the mid-1970s through the early '80s, when inflation crept from 4.8% in 1976 to 13.3% in 1979 and 12.4% in 1980, before beginning a long descent. The price of gold leapt to more than $800 (then collapsed to $400 by 1981).
The same can't be said of 2022, however, even though inflation spiked around the globe. Heck, in the U.S., inflation hit levels not seen in four decades.
Gold prices climbed about 13% for the year to date (YTD) at one point in the first few months of 2022, but they were also down as much as 10% YTD by November.
By year's end, gold prices were essentially unchanged.
Want a guaranteed inflation hedge? Try Treasury Inflation-Protected Securities (TIPS).

Gold can be a good hedge in a crisis
Gold can soar in value during hard times, when fearful and uncertain investors seek safety. Look at the diverging paths that stocks and gold took in 2020 amid the outbreak of COVID-19.
When the pandemic-fueled selloff in stocks finally bottomed out on March 23, the S&P 500 was sitting on a year-to-date loss of more than 30%. Gold prices, however, held firm. By March 23, they were up about 1% for the year-to-date.
Then the real fun began. Gold went on a tear about the next four-plus months, rallying 36% through August 6, when it hit a high of $2,067.20 an ounce.
As noted, the 21st century has given gold several opportunities to shine. The turmoil that followed the September 11, 2001, terrorist attacks and continuing through the 2008-09 economic meltdown was bullish for gold investors.
These days, trade fears and rising government deficits helped gold vault past $4,000 for the first time ever. That was good for a more than 50% gain through the first 10 months of the year, easily outpacing stocks and bonds.
Bottom line: it's not unusual to see gold's price rise with bad news (such as the global pandemic or a sovereign debt crisis) and drop with good news (such as better-than-expected economic growth).
Don't believe the hype: Gold is not a good store of value
A longtime argument in favor of investing in gold is that it is a good store of value — that is, its inflation-adjusted price remains relatively stable over long periods.
A store of value implies a steady price, and as we have seen, gold prices are anything but steady. Although gold's correlation to stocks is complicated, suffice to say the precious metal can be volatile. In 2012, for example, the price rose almost 6%. In 2013, it tumbled 28%. In 2017? Up 12.6%. Down 1.2% in 2018.
The same goes for longer time frames. Take the past decade, for example, and cut it in half. During the first five years ended April 15, 2016, gold prices fell about 16.5%. Since then? Gold is up about 50% in the past three years.


Gold funds are better than physical gold
As attractive as coins and bullion might be, funds are the easiest way for retail investors to get exposure to gold.
No wonder: It's much easier to get gold exposure by holding a gold fund electronically in a brokerage account rather than receiving, storing and insuring the physical metal.
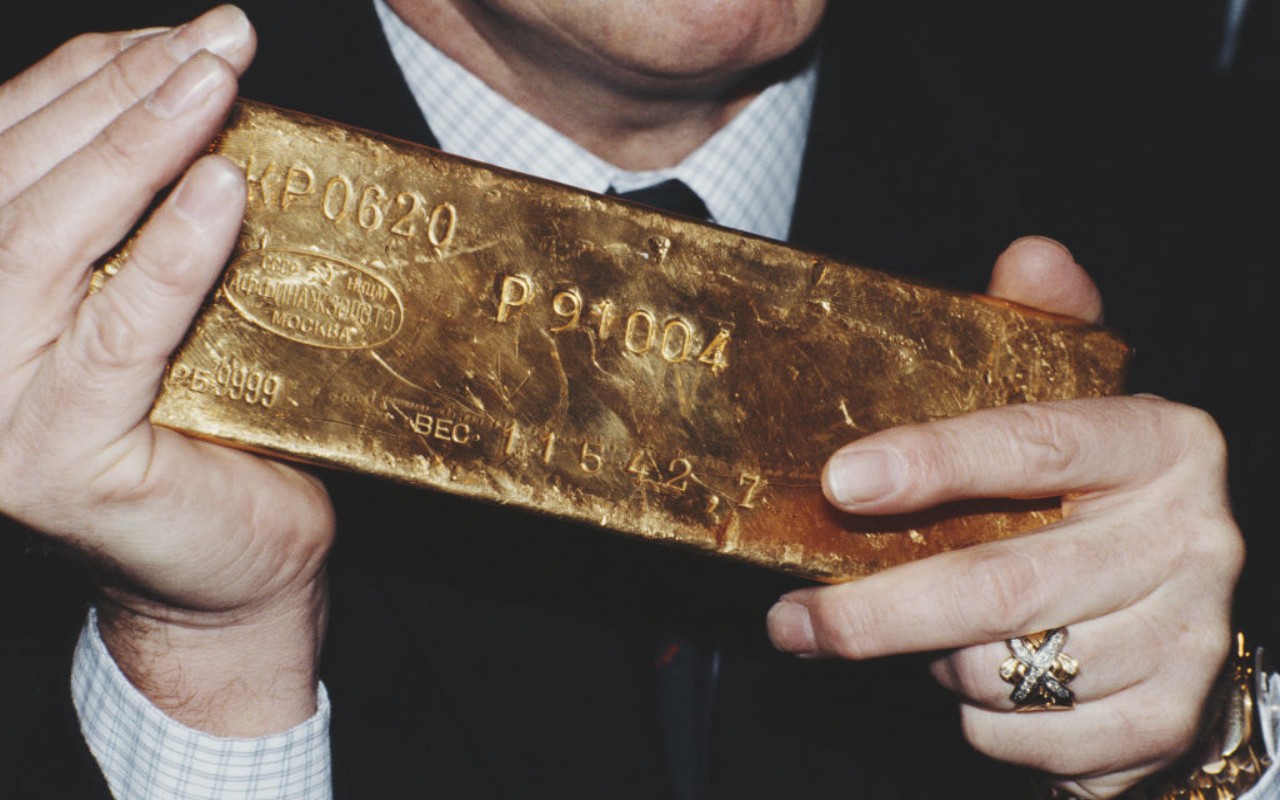
It's also incredibly heavy. The gold bars stored in the New York Fed's gold vault weigh 27 pounds each.
SPDR Gold Shares (GLD), the world’s largest gold-backed exchange-traded fund, has about $105 billion in assets. The ETF tracks the price of gold bullion.
If you choose to invest this way, Kiplinger prefers the lower-cost iShares Gold Trust (IAU), which has annual expenses of 0.25%, compared with 0.40% for GLD.
You also can invest in numerous gold mutual funds and ETFs that invest in the stocks of gold-mining companies.

Hi-ho, Silver
Gold prices can be volatile, but they're nothing compared with silver. The market for silver is smaller than for gold.
Silver has more industrial uses than gold, making the former’s price more sensitive to the ups and downs of the economy. These two factors combine to make silver’s price jumpier than gold’s.
If you want a good night's sleep, go with gold investing, not silver.
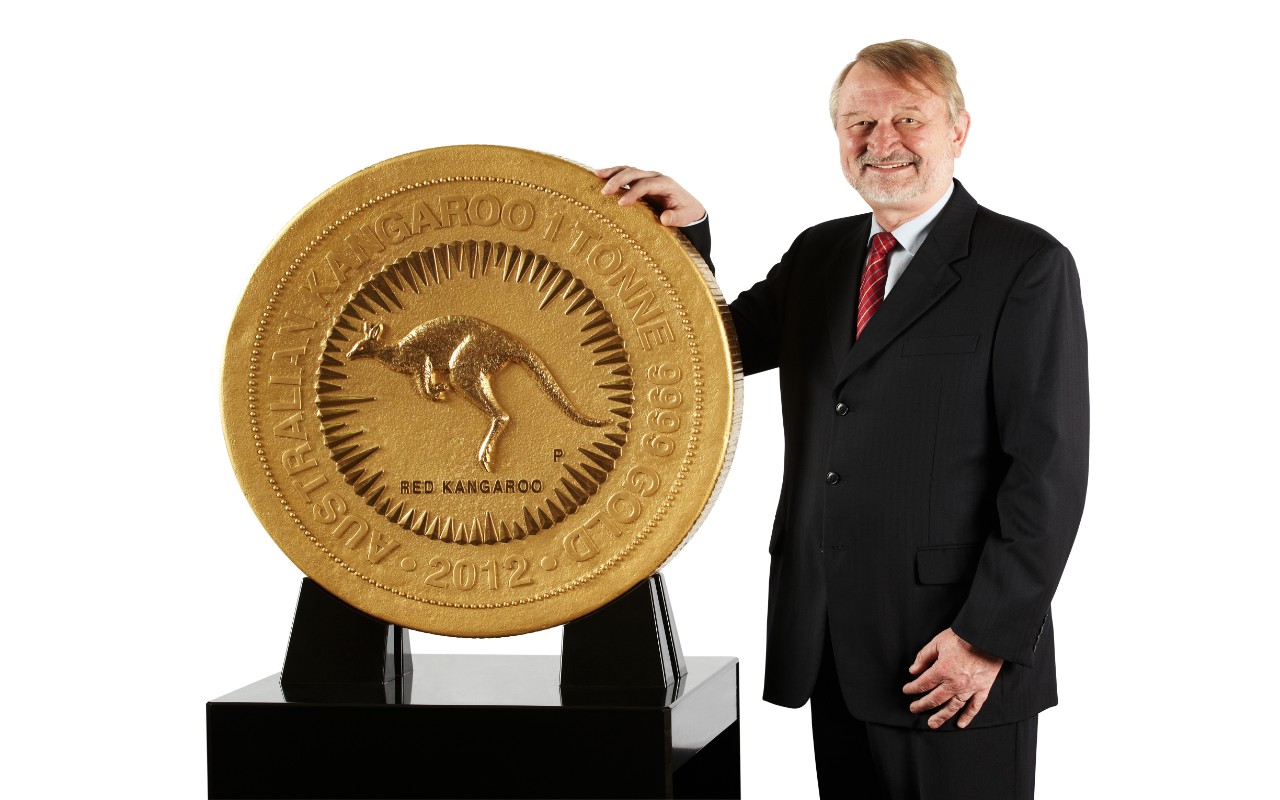
The biggest gold coin is the size of a manhole cover
The largest legal tender gold coin ever produced was struck by the Perth Mint in Western Australia in 2012.
The 2012 "Australian Kangaroo One Tonne Gold Coin" contains one metric tonne of 99.99% pure gold, and is approximately 80 centimeters in diameter by 12 centimeters thick.
The massive coin has a face value of $1 million Australian dollars (AUD). However, the coin's gold content alone would be worth approximately $120 million USD at today's prices.
Related Content
Profit and prosper with the best of Kiplinger's advice on investing, taxes, retirement, personal finance and much more. Delivered daily. Enter your email in the box and click Sign Me Up.

Dan Burrows is Kiplinger's senior investing writer, having joined the publication full time in 2016.
A long-time financial journalist, Dan is a veteran of MarketWatch, CBS MoneyWatch, SmartMoney, InvestorPlace, DailyFinance and other tier 1 national publications. He has written for The Wall Street Journal, Bloomberg and Consumer Reports and his stories have appeared in the New York Daily News, the San Jose Mercury News and Investor's Business Daily, among many other outlets. As a senior writer at AOL's DailyFinance, Dan reported market news from the floor of the New York Stock Exchange.
Once upon a time – before his days as a financial reporter and assistant financial editor at legendary fashion trade paper Women's Wear Daily – Dan worked for Spy magazine, scribbled away at Time Inc. and contributed to Maxim magazine back when lad mags were a thing. He's also written for Esquire magazine's Dubious Achievements Awards.
In his current role at Kiplinger, Dan writes about markets and macroeconomics.
Dan holds a bachelor's degree from Oberlin College and a master's degree from Columbia University.
Disclosure: Dan does not trade individual stocks or securities. He is eternally long the U.S equity market, primarily through tax-advantaged accounts.
-
 Ask the Tax Editor: Federal Income Tax Deductions
Ask the Editor In this week's Ask the Editor Q&A, Joy Taylor answers questions on federal income tax deductions
-
 States With No-Fault Car Insurance Laws (and How No-Fault Car Insurance Works)
A breakdown of the confusing rules around no-fault car insurance in every state where it exists.
-
 7 Frugal Habits to Keep Even When You're Rich
Some frugal habits are worth it, no matter what tax bracket you're in.
-
 The Best Precious Metals ETFs to Buy in 2026
Precious metals ETFs provide a hedge against monetary debasement and exposure to industrial-related tailwinds from emerging markets.
-
 For the 2% Club, the Guardrails Approach and the 4% Rule Do Not Work: Here's What Works Instead
For retirees with a pension, traditional withdrawal rules could be too restrictive. You need a tailored income plan that is much more flexible and realistic.
-
 Retiring Next Year? Now Is the Time to Start Designing What Your Retirement Will Look Like
This is when you should be shifting your focus from growing your portfolio to designing an income and tax strategy that aligns your resources with your purpose.
-
 I'm a Financial Planner: This Layered Approach for Your Retirement Money Can Help Lower Your Stress
To be confident about retirement, consider building a safety net by dividing assets into distinct layers and establishing a regular review process. Here's how.
-
 Stocks Sink With Alphabet, Bitcoin: Stock Market Today
A dismal round of jobs data did little to lift sentiment on Thursday.
-
 The 4 Estate Planning Documents Every High-Net-Worth Family Needs (Not Just a Will)
The key to successful estate planning for HNW families isn't just drafting these four documents, but ensuring they're current and immediately accessible.
-
 Love and Legacy: What Couples Rarely Talk About (But Should)
Couples who talk openly about finances, including estate planning, are more likely to head into retirement joyfully. How can you get the conversation going?
-
 How to Get the Fair Value for Your Shares When You Are in the Minority Vote on a Sale of Substantially All Corporate Assets
When a sale of substantially all corporate assets is approved by majority vote, shareholders on the losing side of the vote should understand their rights.
