3 Lessons for Investors From the Tech Bubble
Most of Nasdaq's darlings at the 2000 peak haven't come close to regaining their value.

Profit and prosper with the best of Kiplinger's advice on investing, taxes, retirement, personal finance and much more. Delivered daily. Enter your email in the box and click Sign Me Up.
You are now subscribed
Your newsletter sign-up was successful
Want to add more newsletters?

Delivered daily
Kiplinger Today
Profit and prosper with the best of Kiplinger's advice on investing, taxes, retirement, personal finance and much more delivered daily. Smart money moves start here.

Sent five days a week
Kiplinger A Step Ahead
Get practical help to make better financial decisions in your everyday life, from spending to savings on top deals.

Delivered daily
Kiplinger Closing Bell
Get today's biggest financial and investing headlines delivered to your inbox every day the U.S. stock market is open.

Sent twice a week
Kiplinger Adviser Intel
Financial pros across the country share best practices and fresh tactics to preserve and grow your wealth.

Delivered weekly
Kiplinger Tax Tips
Trim your federal and state tax bills with practical tax-planning and tax-cutting strategies.

Sent twice a week
Kiplinger Retirement Tips
Your twice-a-week guide to planning and enjoying a financially secure and richly rewarding retirement

Sent bimonthly.
Kiplinger Adviser Angle
Insights for advisers, wealth managers and other financial professionals.

Sent twice a week
Kiplinger Investing Weekly
Your twice-a-week roundup of promising stocks, funds, companies and industries you should consider, ones you should avoid, and why.

Sent weekly for six weeks
Kiplinger Invest for Retirement
Your step-by-step six-part series on how to invest for retirement, from devising a successful strategy to exactly which investments to choose.
Fifteen years ago, on March 10, 2000, the Nasdaq Composite index peaked at 5048. Then it started to fall. And fall. And fall. Or, to use the popular metaphor, the bubble burst.
Looking back, anyone today can see that the big-capitalization technology stocks that dominated the Nasdaq were wildly overvalued by traditional measures. On March 14, 2000, the Wall Street Journal published an influential article titled "Big-Cap Tech Stocks Are a Sucker Bet,” by Jeremy Siegel, the Wharton School finance professor (and fellow Kiplinger’s columnist). Siegel argued that “many of today’s investors are unfazed by history—and by the failure of any large-cap stock ever to justify, by its subsequent record, a [price-earnings] ratio anywhere near 100.” The piece carried a table showing that the P/Es of many Nasdaq darlings were deep into triple digits. Cisco Systems (symbol CSCO), for example, had a P/E of 148; Oracle (ORCL), 153; Qualcomm (QCOM), 167.
Bigger fools. The nature of bubbles, however, is that no one can tell when they’ll pop. If the Nasdaq was overvalued in 2000, it was also overvalued in 1999 and 1998 and 1997. Investors rushed to buy stocks in the late 1990s so they would not miss out on the profits that their friends were making. The buyers, many of them overloading their portfolios with big-cap tech stocks, firmly believed they could sell to some greater fool who would always pay more than they did.
From just $107.88 $24.99 for Kiplinger Personal Finance
Become a smarter, better informed investor. Subscribe from just $107.88 $24.99, plus get up to 4 Special Issues

Sign up for Kiplinger’s Free Newsletters
Profit and prosper with the best of expert advice on investing, taxes, retirement, personal finance and more - straight to your e-mail.
Profit and prosper with the best of expert advice - straight to your e-mail.
The trigger for the collapse of tech stocks wasn’t the economy. It was investor psychology, turning on one event: America Online’s $182 billion purchase in early 2000 of Time Warner, owner of Warner Brothers, CNN, HBO, Time magazine and much more. AOL was a celebrated company in the late 1990s, but it looks pretty paltry today. At the time of the merger, it was simply a dial-up Internet service provider with little content and just 20 million customers. The combined company, known as AOL–Time Warner, carried a P/E, according to Siegel’s table, of 217. It was the largest merger ever and, in the end, an utter disaster for shareholders of both companies. “To call the transaction the worst in history, as it is now taught in business schools, does not begin to tell the story,” the New York Times said in an article 10 years later. The AOL–Time Warner merger—so huge and so absurd—seemed to wake investors from their stupor. Siegel’s article, appearing four days after the Nasdaq peak, helped as well. On October 9, 2002, the Nasdaq Composite closed at 1114, a drop of 78% in 30 months. Even more significant, however, is the fact that the Nasdaq has not yet returned to its 2000 high.
The overall market, as measured by Standard & Poor’s 500-stock index, also plunged over the same period, losing nearly half of its value. But the S&P recovered within seven years, and today it is one-third above its 2000 peak. The Dow is now more than 50% above its high of 15 years ago. The Nasdaq, by contrast, was still 7% shy of its March 2000 record as of January 9.
Every investor can draw lessons from the tech debacle and its aftermath:
1. No specific stock or sector is destined to rise forever. What goes up and then down does not always go back up again. Even regaining 5048 will still mean real losses for the Nasdaq Composite. Although inflation has been relatively mild over the past 15 years, it has eroded the value of the dollar by about 30%, and Nasdaq’s tiny dividend yield (currently 1.3% and a microscopic 0.1% in 2000) doesn’t make up for the decline in buying power.
But forget inflation. Most of Nasdaq’s darlings at the top of the bubble haven’t come close to regaining their value. In 2000, the peak market cap of Microsoft (MSFT), then the world’s most valuable company, was $642 billion; today, it’s $389 billion. Cisco has fallen from $557 billion to $142 billion. Nortel Networks, a Canadian firm with a peak market cap of $283 billion, is in bankruptcy, and Lucent Technologies, once worth $285 billion, is now a part of Alcatel-Lucent (ALU), a French company with a cap of just $10 billion. (Market caps are as of January 9.)
2. It is nearly impossible for an investor to avoid being caught up in a stock frenzy of some sort. There’s always a reason—even beyond the greater-fool theory—to justify a high share price. In the case of the tech bubble of the late 1990s, it was that the Internet would revolutionize … well, everything. The truth is that it almost has. But its most important economic characteristic—tearing down barriers to entry in practically every business—has brought both fantastic innovation and the kind of vicious competition that is unkind to a stock’s price.
3. The best insurance against stock market disaster is diversification. Even if your investment horizon is decades long, it won’t help if you hold only a handful of stocks or sectors. Where many investors went wrong during the tech boom was in not rebalancing their portfolios. Imagine that in 1990, you owned a portfolio split evenly between the Nasdaq Composite and the Dow Jones industrial average. In a decade, your Nasdaq holdings rose by a factor of 12; the Dow roughly quadrupled. So as 2000 began, your portfolio was roughly 75% in Nasdaq stocks and 25% in Dow stocks. Such a lopsided portfolio simply begs for trouble.
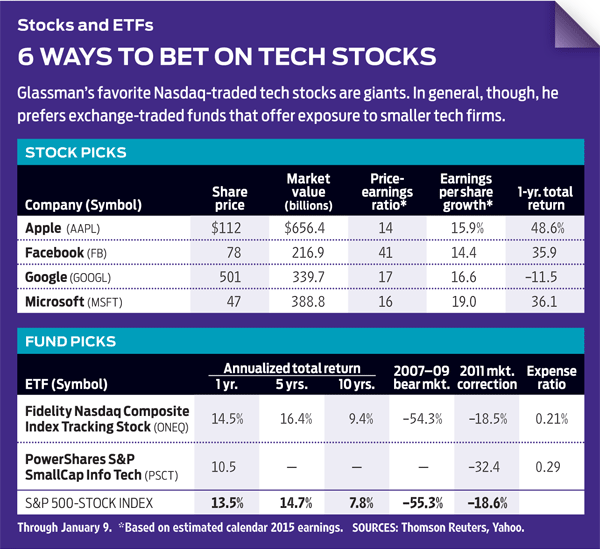
The Nasdaq Composite is still dominated by a small number of mega-cap tech stocks. Fidelity Nasdaq Composite Index Tracking Stock (ONEQ), an exchange-traded fund, is designed to track the index, which contains roughly 3,000 companies. But the 10 largest stocks in the ETF represent one-third of its assets. Eight of those are tech companies, and one is Internet retailer Amazon.com (AMZN). Overall, tech makes up about half the assets of the ETF, compared with about one-fourth of the S&P 500’s assets.
The popular alternative to owning the Composite is to invest in PowerShares QQQ (QQQ), an ETF that tracks the Nasdaq 100, an index of the largest nonfinancial stocks on the Nasdaq exchange. But here you get an even more concentrated dose of large-cap techs. The top 10 stocks in QQQ (the same ones, of course, as those in the Nasdaq Composite) represent a whopping 47% of the $39 billion ETF’s assets. At the top of the list: Apple (AAPL), at 14% of assets; Microsoft, at 8%; and Google (GOOGL), at 4%.
I like many of the behemoths that dominate both of these ETFs—specifically, Apple, Microsoft, Google and Facebook (FB). But when investing in tech, I prefer smaller companies that have a chance to grow into bigger ones, rather than bigger companies whose growth rates are slowing. Consider an ETF such as PowerShares S&P SmallCap Info Tech (PSCT), whose largest holding is Maximus (MMS), a health-services consulting firm with a market cap of $3.6 billion.
If you must own the Nasdaq, then buy the Composite ETF rather than QQQ. Otherwise, cherry-pick the best big tech stocks, own funds that focus on small techs, or do the research to find great small techs on your own. But diversify. Realize that sometimes it takes 15 years for stocks to recover from a debacle—and some never do.
James K. Glassman is a visiting fellow at the American Enterprise Institute. He owns none of the stocks mentioned.
Profit and prosper with the best of Kiplinger's advice on investing, taxes, retirement, personal finance and much more. Delivered daily. Enter your email in the box and click Sign Me Up.

-
 The New Reality for Entertainment
The Kiplinger Letter The entertainment industry is shifting as movie and TV companies face fierce competition, fight for attention and cope with artificial intelligence.
-
 Stocks Sink With Alphabet, Bitcoin: Stock Market Today
A dismal round of jobs data did little to lift sentiment on Thursday.
-
 Betting on Super Bowl 2026? New IRS Tax Changes Could Cost You
Taxable Income When Super Bowl LX hype fades, some fans may be surprised to learn that sports betting tax rules have shifted.
-
 Stocks Sink With Alphabet, Bitcoin: Stock Market Today
A dismal round of jobs data did little to lift sentiment on Thursday.
-
 Dow Leads in Mixed Session on Amgen Earnings: Stock Market Today
The rest of Wall Street struggled as Advanced Micro Devices earnings caused a chip-stock sell-off.
-
 Nasdaq Slides 1.4% on Big Tech Questions: Stock Market Today
Palantir Technologies proves at least one publicly traded company can spend a lot of money on AI and make a lot of money on AI.
-
 Fed Vibes Lift Stocks, Dow Up 515 Points: Stock Market Today
Incoming economic data, including the January jobs report, has been delayed again by another federal government shutdown.
-
 Stocks Close Down as Gold, Silver Spiral: Stock Market Today
A "long-overdue correction" temporarily halted a massive rally in gold and silver, while the Dow took a hit from negative reactions to blue-chip earnings.
-
 Nasdaq Drops 172 Points on MSFT AI Spend: Stock Market Today
Microsoft, Meta Platforms and a mid-cap energy stock have a lot to say about the state of the AI revolution today.
-
 S&P 500 Tops 7,000, Fed Pauses Rate Cuts: Stock Market Today
Investors, traders and speculators will probably have to wait until after Jerome Powell steps down for the next Fed rate cut.
-
 S&P 500 Hits New High Before Big Tech Earnings, Fed: Stock Market Today
The tech-heavy Nasdaq also shone in Tuesday's session, while UnitedHealth dragged on the blue-chip Dow Jones Industrial Average.