Expecting a 12% Return on Your Portfolio? That’s Dangerous
When you factor in volatility and inflation, as well as taxes, fees and asset allocation, a more realistic expectation would be 7%, maybe even 5%. Here’s why.


Profit and prosper with the best of Kiplinger's advice on investing, taxes, retirement, personal finance and much more. Delivered daily. Enter your email in the box and click Sign Me Up.
You are now subscribed
Your newsletter sign-up was successful
Want to add more newsletters?

Delivered daily
Kiplinger Today
Profit and prosper with the best of Kiplinger's advice on investing, taxes, retirement, personal finance and much more delivered daily. Smart money moves start here.

Sent five days a week
Kiplinger A Step Ahead
Get practical help to make better financial decisions in your everyday life, from spending to savings on top deals.

Delivered daily
Kiplinger Closing Bell
Get today's biggest financial and investing headlines delivered to your inbox every day the U.S. stock market is open.

Sent twice a week
Kiplinger Adviser Intel
Financial pros across the country share best practices and fresh tactics to preserve and grow your wealth.

Delivered weekly
Kiplinger Tax Tips
Trim your federal and state tax bills with practical tax-planning and tax-cutting strategies.

Sent twice a week
Kiplinger Retirement Tips
Your twice-a-week guide to planning and enjoying a financially secure and richly rewarding retirement

Sent bimonthly.
Kiplinger Adviser Angle
Insights for advisers, wealth managers and other financial professionals.

Sent twice a week
Kiplinger Investing Weekly
Your twice-a-week roundup of promising stocks, funds, companies and industries you should consider, ones you should avoid, and why.

Sent weekly for six weeks
Kiplinger Invest for Retirement
Your step-by-step six-part series on how to invest for retirement, from devising a successful strategy to exactly which investments to choose.
The power of compounding is an important concept that investors need to understand. Investing consistently and starting earlier in your life (i.e., age 25) can result in hundreds of thousands more dollars in your investment account than if you were to start 10 years later.
While quite a few personal finance pundits have suggested that a stock investor can expect a 12% annual return, when you incorporate the impact of volatility and inflation, 7% is a more accurate historical estimate for an aggressive investor (someone primarily invested in stocks), and 5% would be more appropriate for someone invested in a balanced portfolio of stocks and bonds.
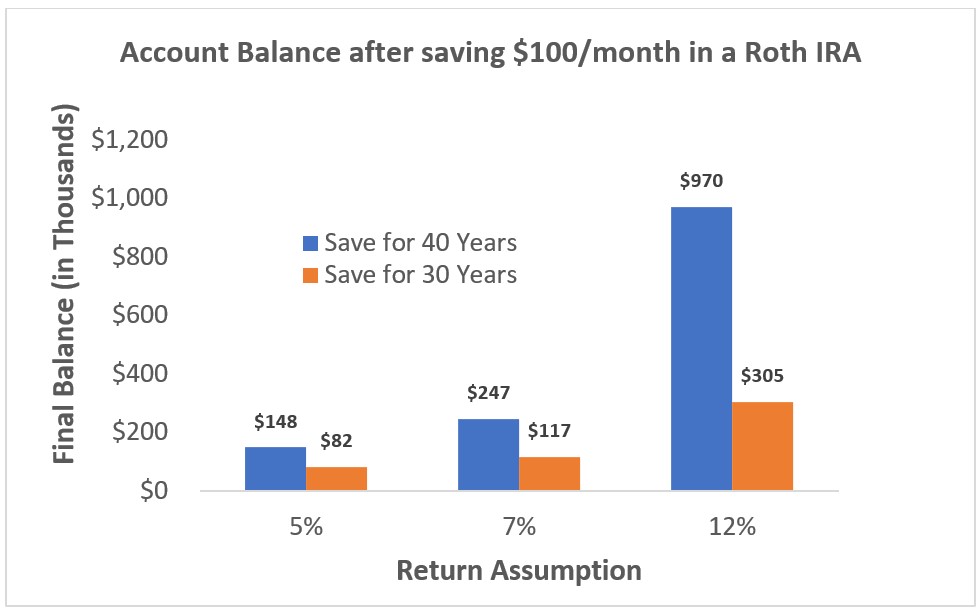
The chart below illustrates how dramatically different account balances might be using different return assumptions, assuming you save $100 a month in a Roth IRA.
From just $107.88 $24.99 for Kiplinger Personal Finance
Become a smarter, better informed investor. Subscribe from just $107.88 $24.99, plus get up to 4 Special Issues

Sign up for Kiplinger’s Free Newsletters
Profit and prosper with the best of expert advice on investing, taxes, retirement, personal finance and more - straight to your e-mail.
Profit and prosper with the best of expert advice - straight to your e-mail.

While it’s true you can achieve a balance of nearly $1 million if you save $100 per month for 40 years assuming a 12% return, that’s incredibly unlikely when you factor in market volatility and inflation. In reality, if we assume a 7% return, which even still may be a touch optimistic, it will require saving $400 a month, or four times as much, to generate that same $1 million.
In other words, not only is 12% an incredibly unrealistic assumption using historical data, but it’s also actually quite dangerous since it could result in radically undersaving for retirement.
So, where does 12% come from?
Investing is a fundamentally uncertain exercise. No one knows what the markets are going to do in the future, and so a common starting place is to look at historical U.S. market performance.
The U.S. has had one of the best financial markets in the world over the last century, and while this may paint an unrealistic picture about future market performance, it does provide some useful context about expectations. One of the most commonly used historical datasets is the Stocks, Bonds, Bills, and Inflation (SBBI®) series.
The SBBI data spans 98 calendar years, from 1926 to 2023. If we take the simple average of the historical returns over this period, you’d get 12.2%. That’s the 12% everyone always talks about!
The problem is, even if you’d invested in that exact same stock market index over that period, you would have actually earned 10.3% (not 12.2%), due to the effects of volatility. Even the 10% estimate doesn’t include inflation, which has averaged about 3% a year, further reducing the historical return closer to 7%.
Tack on things like fees and taxes, and even 7% is probably a relatively high long-term return assumption for a portfolio, especially based on market forecasts today. Had you been invested in a balanced portfolio, your return after considering volatility and inflation would have been closer to 5%. I’ll dig deeper more next.
Volatility is not your friend
The simple average, or arithmetic average, is calculated by adding up some number of values and dividing by the number of observations. So, the 12.2% historical long-term average return is estimated by summing up all the historical returns (which equal 1,191.81%) and dividing by the number of observations (98).
The problem with this approach is that it doesn’t accurately reflect what happens to wealth when you experience a negative return. Simply put, negative returns hurt long-term performance more than positive returns. Here’s an example: Let’s say you have an initial portfolio worth $100 and it achieves a return of +100% in the first year and -50% in the second year. The simple average return would be +25% (+100% + -50% = +50% / 2 = +25%), suggesting you’d have a final balance of around $150 at the end of the two-year period. Sounds fantastic, right? However, in reality your final balance is the original $100, and your realized return is 0%.
How could that be? Well, if you have $100 and the portfolio return is +100%, you now have $200. If the return is then -50% you’d lose half the balance and be back to the original investment of $100. That’s because negative returns hurt more than positive returns when it comes to building wealth, and why you can’t use the simple average as the expectation for long-term performance.
A better metric is what’s called the compound return, or the geometric return, that explicitly incorporates the impact of volatility on wealth growth over time. I won’t get in the weeds here, but here’s a reference if you’re interested in learning more about the calculations. What’s important, though, is that using the geometric return, the growth rate of an investor’s portfolio would not have been 12% historically, it would have been closer to 10%.
Have there been 30-year periods where the geometric return has been higher than 12%? Of course! The highest average 30-year geometric return was 13.7%, so it’s definitely possible. At the same time, though, the lowest average 30-year geometric return has been 8.5%, so it’s been lower as well.
Inflation is also not your friend
The second important consideration that the 12% long-term return estimate ignores is inflation. Inflation is simply a measure of how a set of goods or services changes over a certain period. The most common estimates of inflation in the U.S. are based on the consumer price index (CPI), calculated by the Bureau of Labor Statistics.
The long-term inflation rate from 1926 to 2023 has been about 3%. This means that the price of goods and services have increased on average by 3% per year over that 98-year period. When thinking about the long-term growth of wealth, we need to back out inflation, since we want to buy things in today’s dollars. That means the 10% geometric return is really more like a 7% return when we account for inflation.
Using the return before inflation, called the nominal return, effectively assumes that everything is going to cost the same in the future, which is incredibly inconsistent with historical evidence and future projections around inflation rates.
Other considerations
The initial 12% return drops to 7% when considering the implications of volatility and inflation, but there are other considerations that could cause it to drop even further. This includes fees, taxes and asset allocation.
First, let’s talk fees. The index return doesn’t account for any sort of historical fees, but investing has never been free, especially if we go further back in time. The Vanguard S&P 500 investor index had an expense ratio of 0.43% back in 1976. The cost of investing was even higher if we go back further in time. While these costs have come down significantly, almost approaching zero, they definitely haven’t been zero historically, which would have reduced returns realized by investors.
Second, we can’t forget about taxes. Taxes are going to reduce the compound return for individuals, especially those who are investing in a taxable account. This is something known as tax drag, and it can be especially significant for investments with higher levels of income or turnover.
Third, asset allocation will have an impact on returns. Very few retirees should be invested entirely in equities. A decent target for how much of your portfolio you should have in equities is 110 minus your age. So, at age 65, a 55% equity allocation is a reasonable starting place. If you consider a balanced portfolio of 50% stocks and 50% bonds, the 7% geometric after-inflation return falls to 5%.
Now what?
While 7% is a far more accurate reflection of the long-term return of investing in equities, and 5% for a balanced portfolio, it’s important to note these historical returns are not necessarily consistent with forecasts. As noted previously, the U.S. has had one of the best financial markets historically, and I worry that future returns could be more similar to our international peers. For example, the PGIM Quantitative Solutions Q4 2023 Capital Market Assumptions for the future inflation-adjusted return on stocks is closer to 5%, which is significantly lower than the historical long-term average.
Using lower expected returns could result in higher required savings rates in accumulation or lower spending levels in retirement, but it’s important that assumptions in any financial plan be as reasonable as possible, and to reiterate, a 12% return assumption on stocks isn’t just unreasonable, it’s dangerous.
Related Content
- Your Retirement Readiness Rx: Plan Early and Get Help
- Five Investing Alternatives for Conservative Investors
- Five Common Retirement Mistakes and How to Avoid Them
- Four Historical Patterns in the Markets for Investors to Know
- What’s the Difference Between Average and Actual Rate of Return?
Profit and prosper with the best of Kiplinger's advice on investing, taxes, retirement, personal finance and much more. Delivered daily. Enter your email in the box and click Sign Me Up.

David Blanchett, PhD, CFA, CFP®, is Managing Director and Head of Retirement Research for PGIM DC Solutions. PGIM is the global investment management business of Prudential Financial, Inc. In this role he develops research and innovative solutions to help improve retirement outcomes for investors with a focus on defined contribution plans. Prior to joining PGIM he was the Head of Retirement Research for Morningstar Investment Management. He is currently an Adjunct Professor of Wealth Management at The American College of Financial Services and Research Fellow for the Alliance for Lifetime Income. David has published over 100 papers in a variety of industry and academic journals that have received awards from the CFP Board, the Financial Analysts Journal, the Journal of Financial Planning, and the International Centre for Pension Management. In 2014 InvestmentNews included him in their inaugural 40 under 40 list as a “visionary” for the financial planning industry, and in 2021 ThinkAdvisor included him in the IA25+. When David isn’t working, he’s probably out for a jog, playing with his four kids, or rooting for the Kentucky Wildcats.
-
 Ask the Tax Editor: Federal Income Tax Deductions
Ask the Editor In this week's Ask the Editor Q&A, Joy Taylor answers questions on federal income tax deductions
-
 States With No-Fault Car Insurance Laws (and How No-Fault Car Insurance Works)
A breakdown of the confusing rules around no-fault car insurance in every state where it exists.
-
 Why Picking a Retirement Age Feels Impossible (and How to Finally Decide)
Struggling with picking a date? Experts explain how to get out of your head and retire on your own terms.
-
 For the 2% Club, the Guardrails Approach and the 4% Rule Do Not Work: Here's What Works Instead
For retirees with a pension, traditional withdrawal rules could be too restrictive. You need a tailored income plan that is much more flexible and realistic.
-
 Retiring Next Year? Now Is the Time to Start Designing What Your Retirement Will Look Like
This is when you should be shifting your focus from growing your portfolio to designing an income and tax strategy that aligns your resources with your purpose.
-
 I'm a Financial Planner: This Layered Approach for Your Retirement Money Can Help Lower Your Stress
To be confident about retirement, consider building a safety net by dividing assets into distinct layers and establishing a regular review process. Here's how.
-
 The 4 Estate Planning Documents Every High-Net-Worth Family Needs (Not Just a Will)
The key to successful estate planning for HNW families isn't just drafting these four documents, but ensuring they're current and immediately accessible.
-
 Love and Legacy: What Couples Rarely Talk About (But Should)
Couples who talk openly about finances, including estate planning, are more likely to head into retirement joyfully. How can you get the conversation going?
-
 How to Get the Fair Value for Your Shares When You Are in the Minority Vote on a Sale of Substantially All Corporate Assets
When a sale of substantially all corporate assets is approved by majority vote, shareholders on the losing side of the vote should understand their rights.
-
 How to Add a Pet Trust to Your Estate Plan: Don't Leave Your Best Friend to Chance
Adding a pet trust to your estate plan can ensure your pets are properly looked after when you're no longer able to care for them. This is how to go about it.
-
 Want to Avoid Leaving Chaos in Your Wake? Don't Leave Behind an Outdated Estate Plan
An outdated or incomplete estate plan could cause confusion for those handling your affairs at a difficult time. This guide highlights what to update and when.