Stumbling FANGs? No Problem, Says the Market
Tech leaders swooned in late July, but stocks just kept plodding along


Profit and prosper with the best of Kiplinger's advice on investing, taxes, retirement, personal finance and much more. Delivered daily. Enter your email in the box and click Sign Me Up.
You are now subscribed
Your newsletter sign-up was successful
Want to add more newsletters?

Delivered daily
Kiplinger Today
Profit and prosper with the best of Kiplinger's advice on investing, taxes, retirement, personal finance and much more delivered daily. Smart money moves start here.

Sent five days a week
Kiplinger A Step Ahead
Get practical help to make better financial decisions in your everyday life, from spending to savings on top deals.

Delivered daily
Kiplinger Closing Bell
Get today's biggest financial and investing headlines delivered to your inbox every day the U.S. stock market is open.

Sent twice a week
Kiplinger Adviser Intel
Financial pros across the country share best practices and fresh tactics to preserve and grow your wealth.

Delivered weekly
Kiplinger Tax Tips
Trim your federal and state tax bills with practical tax-planning and tax-cutting strategies.

Sent twice a week
Kiplinger Retirement Tips
Your twice-a-week guide to planning and enjoying a financially secure and richly rewarding retirement

Sent bimonthly.
Kiplinger Adviser Angle
Insights for advisers, wealth managers and other financial professionals.

Sent twice a week
Kiplinger Investing Weekly
Your twice-a-week roundup of promising stocks, funds, companies and industries you should consider, ones you should avoid, and why.

Sent weekly for six weeks
Kiplinger Invest for Retirement
Your step-by-step six-part series on how to invest for retirement, from devising a successful strategy to exactly which investments to choose.
The end of July was brutal for several big tech stocks that posted very visible earnings misses.
Facebook (FB) wasn’t the first company to disappoint, but it got the entire sector reeling when it plummeted 19% and suffered the biggest single-day loss in market value – a massive $119.1 billion. That’s more than the entire market value of Dow Jones Industrial Average component United Technologies (UTX).
The earnings problems continued, including Twitter’s (TWTR) 21% plunge despite beating analyst estimates on the top and bottom lines. User growth was the problem as the company purged itself of suspended and fake accounts.
From just $107.88 $24.99 for Kiplinger Personal Finance
Become a smarter, better informed investor. Subscribe from just $107.88 $24.99, plus get up to 4 Special Issues

Sign up for Kiplinger’s Free Newsletters
Profit and prosper with the best of expert advice on investing, taxes, retirement, personal finance and more - straight to your e-mail.
Profit and prosper with the best of expert advice - straight to your e-mail.
Just about all the FANGs – Facebook, Amazon.com (AMZN), Netflix (NFLX) and Google parent Alphabet (GOOGL), though Apple (AAPL) and Microsoft (MSFT) are frequently included in similar acronyms – fared poorly shortly after earnings.
However, the devastation was not really a surprise for some charting enthusiasts who use price action (and their derivatives) as their guide. No truth-telling technical analyst expected the giant haircut bestowed upon Facebook, but analysis of price momentum suggested that a selloff was in the offing.
A Momentum-Driven Market
There is no doubt that investors were quite enthusiastic about Big Tech as this group led the market higher for the past five years. Every small dip or pullback sparked fresh buying. Everybody, it seemed, needed to have several of these highflying stocks in their portfolio.
When groups of stocks lead in this way, their bullishness breeds more bullishness, no matter what their valuations may be. Pundits classify such a market as a “momentum market,” or momo, for short.
Momentum is the speed of a price advance. Most free charting software offers indicators to measure momentum, and they are quite useful to detect conditions when a rally gets a bit too exuberant.
They also can detect when momentum starts to wane long before a rising stock actually sells off. While they are from perfect, throughout July, the charts showed rising prices with falling momentum.
Think of a ball thrown up into the air. Even as it moves higher, its speed declines. Eventually, gravity overwhelms the power that propelled the ball in the first place and the ball finally starts to head back down.
Which FANG stocks showed such divergences between their price trends and momentum? All of them. So did other superstars, such as Adobe (ADBE), Nvidia (NVDA), Visa (V) and Intel (INTC).
The Death of Momo?
The question for investors must ask is, “Is momo dead?” Can they still buy every dip the market stingily offers? Or is it time to take some profits and maybe even step aside completely?
The reign of the FANGs seems to be in jeopardy. The naysayers who squawked about sky-high valuations and the market’s lack of regard for sound fundamentals finally saw some vindication as many of these leaders stumbled.
The problem is that their stocks just got into a bit of a frenzy that pushed prices up too high, too fast. However, for the most part, these companies still make money and continue to innovate.
The recent corrections in tech stocks were great examples of how the market will eventually clean itself up and allow investors to buy high-quality companies at more realistic prices. For sure, it took a long time to happen, and the selloff in some companies (Facebook) was brutal.
That’s the nature of the stock market. It tells us when it had enough, not the other way around.
The current turbulence seems different than previous declines because the selling followed bad earnings or outlook news, rather than quick bursts of market noise. It suggests the nature of the market changed from momo to something else. That’s not necessarily bearish, especially since most of the FANGs remain in rising, bullish trends – just look at Apple’s recent scoot to new highs and $1 trillion in market capitalization. However, blindly buying every dip may not be the right strategy anymore.
But Is the Broad Market Topping?
Just because momo seems to be over does not mean it is the end of the overall bull market. Far from it.
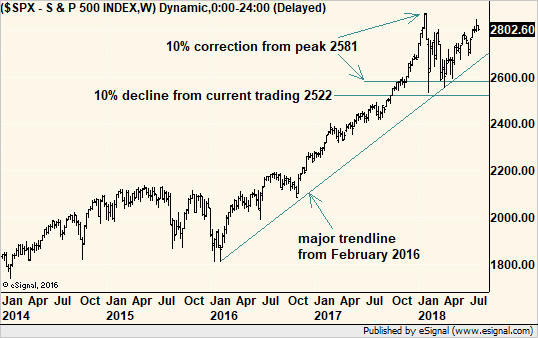
While unsatisfying for those looking for unabashed punditry, the Standard & Poor’s 500-stock index already suffered a 10.16% drop on a daily close basis, in January and February. That’s just above the arbitrary definition of a correction of 10%. But in July, the S&P 500 actually exited correction territory; theoretically, now it should be just a matter of time before the next leg up kicks in.
Look at the weekly chart below. The trend from early 2016 remains intact and rising. And for more advanced chart watchers, another 10% correction from current levels, should that happen, would create a rather substantial floor under the market.

But can the market fall even more than that and reach the also-arbitrary definition of a bear market with a 20% decline from the peak?
Anything is possible, but it seems quite unlikely right now.
After all, the rest of earnings season looks quite healthy, with 77% of companies beating second-quarter analysts estimates so far, according to StreetInsider.com. FactSet reported that earnings growth boomed, with the blended earnings growth rate for Q1 among S&P 500 companies at 23.2%, the highest result since Q3 2010.
Politics aside, the second-quarter GDP growth rate of 4.1% is undeniably good. Yes, it’s expected to slow from that point, but the economy still could grow at a lesser pace and still look strong.
People also feel better about the economy. The IBD/TIPP Economic Optimism Index is holding at levels not seen since 2005, when the housing bubble was still inflating.
Gold, the hedge against bad times, still languishes. If people were feeling nervous, the yellow metal “should” be a bit stronger because gold, silver and some hard assets outperform when fear swells. But amid optimism and actual economic growth, not to mention almost nonexistent inflation, there is no reason to flock to gold now.
Finally, interest rates are still quite low despite the Federal Reserve’s campaign to normalize them by pushing them higher. We could make the counter-argument that stubbornly low interest rates can mean that the bond market does not have confidence in the current economic recovery. But until there is corroboration for that conclusion, we must keep it on the shelf.
As for corroboration for the bullish argument for stocks, while technology stumbles, financials and health care appear to be emerging as leaders, at least for now. This is significant because leadership does move around from sector to sector in a healthy bull market. The term for that is “sector rotation.”
Tech currently represents 26% of the S&P 500’s value, so its loss from the leadership ranks could suggest problems for the broader market. However, health care, at just under 14.1%, and financials, at 13.8%, are the Nos. 2 and 3 sectors. Having them back in the lead is a positive development.
The conclusion? The market still is OK at this time. The potential for another 10% drop is real, but unless it makes a significantly lower low than we saw earlier in the year, the bull-market trend remains intact.
Profit and prosper with the best of Kiplinger's advice on investing, taxes, retirement, personal finance and much more. Delivered daily. Enter your email in the box and click Sign Me Up.

-
 How Much It Costs to Host a Super Bowl Party in 2026
Hosting a Super Bowl party in 2026 could cost you. Here's a breakdown of food, drink and entertainment costs — plus ways to save.
-
 3 Reasons to Use a 5-Year CD As You Approach Retirement
A five-year CD can help you reach other milestones as you approach retirement.
-
 Your Adult Kids Are Doing Fine. Is It Time To Spend Some of Their Inheritance?
If your kids are successful, do they need an inheritance? Ask yourself these four questions before passing down another dollar.
-
 If You'd Put $1,000 Into AMD Stock 20 Years Ago, Here's What You'd Have Today
Advanced Micro Devices stock is soaring thanks to AI, but as a buy-and-hold bet, it's been a market laggard.
-
 Nasdaq Drops 172 Points on MSFT AI Spend: Stock Market Today
Microsoft, Meta Platforms and a mid-cap energy stock have a lot to say about the state of the AI revolution today.
-
 S&P 500 Tops 7,000, Fed Pauses Rate Cuts: Stock Market Today
Investors, traders and speculators will probably have to wait until after Jerome Powell steps down for the next Fed rate cut.
-
 S&P 500 Hits New High Before Big Tech Earnings, Fed: Stock Market Today
The tech-heavy Nasdaq also shone in Tuesday's session, while UnitedHealth dragged on the blue-chip Dow Jones Industrial Average.
-
 Dow Rises 313 Points to Begin a Big Week: Stock Market Today
The S&P 500 is within 50 points of crossing 7,000 for the first time, and Papa Dow is lurking just below its own new all-time high.
-
 Nasdaq Leads Ahead of Big Tech Earnings: Stock Market Today
President Donald Trump is making markets move based on personal and political as well as financial and economic priorities.
-
 11 Stock Picks Beyond the Magnificent 7
With my Mag-7-Plus strategy, you can own the mega caps individually or in ETFs and add in some smaller tech stocks to benefit from AI and other innovations.
-
 Nasdaq Adds 211 Points as Greenland Tensions Ease: Stock Market Today
Wall Street continues to cheer easing geopolitical tensions and President Trump's assurances that there will be no new tariffs on Europe.