How Investors Can Prosper With Technical Analysis
Even the most basic knowledge of stock charts can help you make better investing decisions


Profit and prosper with the best of Kiplinger's advice on investing, taxes, retirement, personal finance and much more. Delivered daily. Enter your email in the box and click Sign Me Up.
You are now subscribed
Your newsletter sign-up was successful
Want to add more newsletters?

Delivered daily
Kiplinger Today
Profit and prosper with the best of Kiplinger's advice on investing, taxes, retirement, personal finance and much more delivered daily. Smart money moves start here.

Sent five days a week
Kiplinger A Step Ahead
Get practical help to make better financial decisions in your everyday life, from spending to savings on top deals.

Delivered daily
Kiplinger Closing Bell
Get today's biggest financial and investing headlines delivered to your inbox every day the U.S. stock market is open.

Sent twice a week
Kiplinger Adviser Intel
Financial pros across the country share best practices and fresh tactics to preserve and grow your wealth.

Delivered weekly
Kiplinger Tax Tips
Trim your federal and state tax bills with practical tax-planning and tax-cutting strategies.

Sent twice a week
Kiplinger Retirement Tips
Your twice-a-week guide to planning and enjoying a financially secure and richly rewarding retirement

Sent bimonthly.
Kiplinger Adviser Angle
Insights for advisers, wealth managers and other financial professionals.

Sent twice a week
Kiplinger Investing Weekly
Your twice-a-week roundup of promising stocks, funds, companies and industries you should consider, ones you should avoid, and why.

Sent weekly for six weeks
Kiplinger Invest for Retirement
Your step-by-step six-part series on how to invest for retirement, from devising a successful strategy to exactly which investments to choose.
Many investment advisors and money managers have a little secret. They will proudly tell you that they rely heavily on fundamental analysis, carefully weighing earnings, market share, competitive environment and demographic trends to select the best stocks for their clients. What they do not tell you is that they check their stock charts before they make any moves.
Why? Because technical analysis of the market – using charts – still is the best way to know whether their other analyses are validated in the real world.
Let’s say a company creates a new product that they project will sell millions of units at a handsome margin. They even get favorable reviews by critics at their industry trade show. Investors armed with this intelligence buy up all the shares they can – then watch them drop sharply in value.
From just $107.88 $24.99 for Kiplinger Personal Finance
Become a smarter, better informed investor. Subscribe from just $107.88 $24.99, plus get up to 4 Special Issues

Sign up for Kiplinger’s Free Newsletters
Profit and prosper with the best of expert advice on investing, taxes, retirement, personal finance and more - straight to your e-mail.
Profit and prosper with the best of expert advice - straight to your e-mail.
How can that be?
What those investors did not know was that the stock was already up 50% on the year, and that sellers were starting to trade with more urgency. So even though the company is sound and will make a lot of money, the stock’s value already reflected that knowledge.
That information is in the charts.
Technical analysis gets a bad rap in the investment world. Don’t blame the analysis. Blame the practitioners. Even I, as a 30-year veteran in the discipline, cringe when I hear a TV interview with a technician forecasting the market because two lines on a chart crossed each other.
The stock does not move because the lines crossed. The lines crossed because the stock is telling us something. And it is telling us whether the odds for buying or for selling are better.
That’s it. It does not tell us exactly what will happen, but it does give us a good idea of what we should do.
There’s plenty of jargon and high-level math for the experts to ponder, but I’d like to take you through a few simple aspects of technical analysis that any investor can use. Once you’re armed with this, you’ll be well on your way toward assembling a winning portfolio.
What Is Technical Analysis?
There are several popular definitions, but I boil it down to this: Technical analysis is just the study of data generated from the market and from the actions of people in the market.
Such data include price levels that served as turning points in the past, the number of shares of stock bought and sold each day (volume), and how fast price movements occur (momentum) over a given period of time.
Let’s say that a stock price of $50 brought out the sellers on one or two occasions in the past. This price level is now called “resistance” (more on this later) because it tends to resist price advances over time. Why? Likely because that level is considered expensive, and therefore when the stock gets near that price, investors step up their selling activities, increasing the supply of stock relative to the demand. Economics 101 suggests the stock will stop going up and may actually start to decline.
Technical analysis, or charting, also attempts to measure how investors feel about the market at any given time. This is important because when everyone thinks the same way, the market tends to do the opposite.
It’s the fear-and-greed pendulum. When everyone is convinced the market is going to keep moving higher, as it did at the peak of the housing bubble or the peak of the bitcoin bubble, then theoretically everyone has already bought. There is nobody left to buy, so any negative news, either actual or perceived, will cause a stampede to the exits.
Remember back in March 2009 at the end of the bear market? Investor sentiment was as negative as it ever was … and in hindsight, it was one of the best buying opportunities in history.
Technical analysis presents the opinion of the market itself through the unchangeable facts of stock price and volume movements.
How It Works
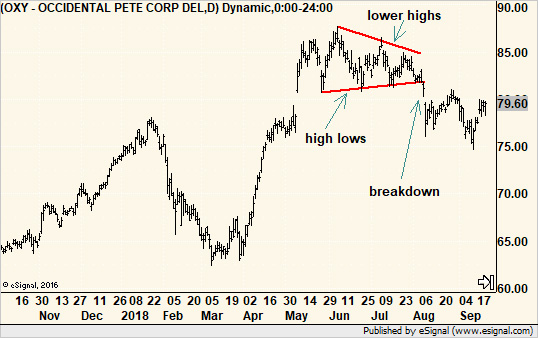
The basic idea is that the collective actions of all market players leave clues in the charts for us to find. Let’s say that after a nice run-up, both bulls and bears become a bit more uncertain. Bulls tend to take their profits a bit earlier, and bears don’t press their short positions (bets against stocks) – essentially the same thing in reverse.
On the charts, we see lower price highs and higher price lows. They form a shrinking trading range that looks like a triangle. In fact, that’s what this pattern is called.

Whenever such a pattern forms in a stock, we know that stock is resting before making a move. Whether that move is to march higher or head lower is yet to be determined. However, most of the time, when price action breaks out of the shrinking trading range, it tends to continue in that direction for a while.
The triangle pattern does not forecast what will happen. However, when the market breaks out from the pattern, we get a good idea what we should do about it.
But even when a stock breaks out from a pattern, chartists do not know for sure that the stock will go up, and they do not know how long it might take. They simply know that the probability of making money by owning the stock is good.
If they are wrong? A failed breakout is possible, but the beauty of the pattern is that it tells us when we are wrong sooner, rather than later, to minimize losses.
There is an old joke where a fundamental analyst and a technical analyst are eating dinner together and someone knocks a knife off the table. It lands firmly in the fundamental analyst’s shoe.
The technician asks, “Why didn’t you move your foot?”
The fundamentalist replies, “I thought it would go back up.”
The knife falling is the same as a downside breakout from a triangle. When that happens, it is best to get out of the way.
How to Use It
You can get as complex as you want, but most investors can benefit from knowing just a few things about the market or the stock they want to buy.
- Is the trend rising or falling?
- What support and resistance levels are nearby?
- For a stock, how does it look compared to its sector and to the market as a whole?
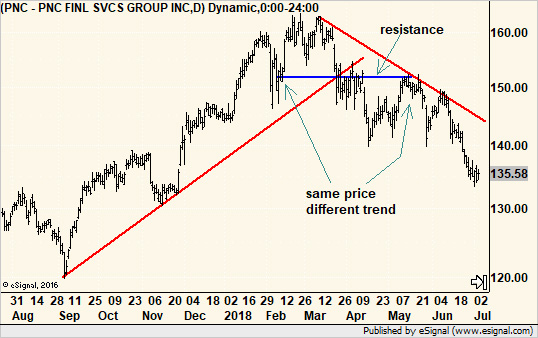
A trend is simply a directional move over time. If prices on the chart seem to move from the lower left corner to the upper right corner, then the trend is rising. (And if it moves from the upper left to the lower right, the trend is falling.)
We can measure how powerful the trend is with momentum and many other indicators. But the bottom line is that a stock or a market making higher highs and higher lows over time is in a rising trend.

As in physics, a body in motion tends to stay in motion unless acted upon by an outside force. Some of these forces come from within the market, such as waning performance or lack of interest (shown by falling volume). There also are price levels.
Support is a price level at which a stock or market tends to stop falling. Resistance is a price level at which it tends to stop rising. Support often represents a cheap price, while resistance often represents an expensive price.
If a stock you want to buy is approaching a price at which sellers got active in the past (resistance), you might want to reconsider that purchase. But if your stock just pushed through that resistance level, you know the market’s psyche may have changed and what was once considered to be expensive may now be considered cheap.
There’s also “relative strength analysis,” which is a comparison to peers, sectors and the broader market. Even during a bull market, some stocks perform better than others. So you may, for instance, not want to load up on lagging areas of the market no matter what the fundamentals might say.
Fundamentals and Technicals Are Partners
While they seem to be at odds, fundamental analysis and technical analysis can complement each other, even if they have different conclusions about the same stock. For example, a stock may be overvalued based on the fundamentals, but if it has a strong chart, it may have more room to run before value players really start to sell. Conversely, a stock may seem fundamentally cheap, but chartists are selling it because it is in a strong declining trend.
That’s not a problem with either method. It’s just that sometimes, the charts see things that don’t yet show up in the fundamentals.
And sometimes non-company-specific news overshadows the fundamentals. For example, a company might issue strong earnings guidance, but that same day, a peer might also release bad news that sends the entire sector lower.
When the fundamentals and technicals agree, investors can buy or sell with confidence. But even when they do not agree, simply being aware of risks from the other side will allow investors to make better decisions.
Profit and prosper with the best of Kiplinger's advice on investing, taxes, retirement, personal finance and much more. Delivered daily. Enter your email in the box and click Sign Me Up.

-
 How Much It Costs to Host a Super Bowl Party in 2026
Hosting a Super Bowl party in 2026 could cost you. Here's a breakdown of food, drink and entertainment costs — plus ways to save.
-
 3 Reasons to Use a 5-Year CD As You Approach Retirement
A five-year CD can help you reach other milestones as you approach retirement.
-
 Your Adult Kids Are Doing Fine. Is It Time To Spend Some of Their Inheritance?
If your kids are successful, do they need an inheritance? Ask yourself these four questions before passing down another dollar.
-
 If You'd Put $1,000 Into AMD Stock 20 Years Ago, Here's What You'd Have Today
Advanced Micro Devices stock is soaring thanks to AI, but as a buy-and-hold bet, it's been a market laggard.
-
 If You'd Put $1,000 Into UPS Stock 20 Years Ago, Here's What You'd Have Today
United Parcel Service stock has been a massive long-term laggard.
-
 If You'd Put $1,000 Into Lowe's Stock 20 Years Ago, Here's What You'd Have Today
Lowe's stock has delivered disappointing returns recently, but it's been a great holding for truly patient investors.
-
 If You'd Put $1,000 Into 3M Stock 20 Years Ago, Here's What You'd Have Today
MMM stock has been a pit of despair for truly long-term shareholders.
-
 If You'd Put $1,000 Into Coca-Cola Stock 20 Years Ago, Here's What You'd Have Today
Even with its reliable dividend growth and generous stock buybacks, Coca-Cola has underperformed the broad market in the long term.
-
 If You Put $1,000 into Qualcomm Stock 20 Years Ago, Here's What You Would Have Today
Qualcomm stock has been a big disappointment for truly long-term investors.
-
 If You'd Put $1,000 Into Home Depot Stock 20 Years Ago, Here's What You'd Have Today
Home Depot stock has been a buy-and-hold banger for truly long-term investors.
-
 If You'd Put $1,000 Into Bank of America Stock 20 Years Ago, Here's What You'd Have Today
Bank of America stock has been a massive buy-and-hold bust.