5 Signs to Watch for a Stock Market Peak
It’s no secret that the current bull market and economic expansion are getting long in the tooth.


Profit and prosper with the best of Kiplinger's advice on investing, taxes, retirement, personal finance and much more. Delivered daily. Enter your email in the box and click Sign Me Up.
You are now subscribed
Your newsletter sign-up was successful
Want to add more newsletters?

Delivered daily
Kiplinger Today
Profit and prosper with the best of Kiplinger's advice on investing, taxes, retirement, personal finance and much more delivered daily. Smart money moves start here.

Sent five days a week
Kiplinger A Step Ahead
Get practical help to make better financial decisions in your everyday life, from spending to savings on top deals.

Delivered daily
Kiplinger Closing Bell
Get today's biggest financial and investing headlines delivered to your inbox every day the U.S. stock market is open.

Sent twice a week
Kiplinger Adviser Intel
Financial pros across the country share best practices and fresh tactics to preserve and grow your wealth.

Delivered weekly
Kiplinger Tax Tips
Trim your federal and state tax bills with practical tax-planning and tax-cutting strategies.

Sent twice a week
Kiplinger Retirement Tips
Your twice-a-week guide to planning and enjoying a financially secure and richly rewarding retirement

Sent bimonthly.
Kiplinger Adviser Angle
Insights for advisers, wealth managers and other financial professionals.

Sent twice a week
Kiplinger Investing Weekly
Your twice-a-week roundup of promising stocks, funds, companies and industries you should consider, ones you should avoid, and why.

Sent weekly for six weeks
Kiplinger Invest for Retirement
Your step-by-step six-part series on how to invest for retirement, from devising a successful strategy to exactly which investments to choose.
It’s no secret that the current bull market and economic expansion are getting long in the tooth. Eventually, the market will turn bearish, and history tells us that we’re likely to see a recesssion six to nine months after the bull market’s peak.
These five indicators can help you spot market tops and recessions on the horizon. Think of them as alarm bells. None is ringing loudly at the moment, but if several go off in unison, consider paring back risk in your portfolio.

Consumer Confidence
- The indicator: The Conference Board’s Consumer Confidence Index, released monthly, tracks consumers’ attitudes about business and economic conditions.
- Why watch it: Consumer spending drives nearly 70% of U.S. economic activity. “A sharp drop in confidence implies that a recession is imminent,” says Ed Clissold, chief strategist at investment research firm Ned Davis Research. On average, recessions have occurred when the index dips to a level of 63 or below, he says.
- What it says now: At 133.4, the Conference Board index is far from recession territory, says Clissold.

Market Breadth
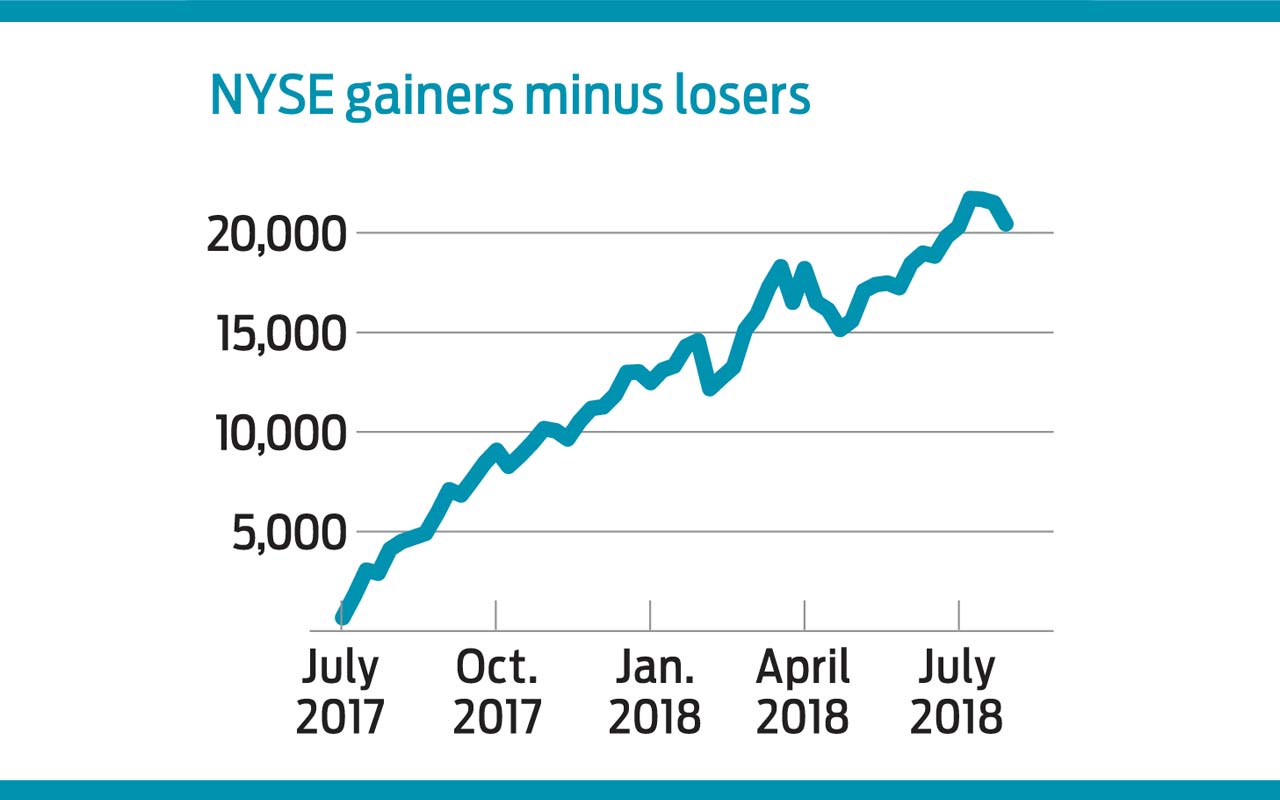
- The indicator: The advance-decline line represents the cumulative number of NYSE stocks with advancing share prices minus those that are declining, plotted over time.
- Why watch it: The A-D line tells you how many stocks are participating in a trend. If the generals are charging while the troops are in retreat, a bear market may be on the horizon, says James Stack, publisher of InvesTech Research.
- What it says now: Although tech titans make headlines, the market’s gains remain broad-based, says Clissold. The A-D line has stayed positive this year as U.S. indexes have climbed.

Market Leadership
- The indicator: The number of stocks hitting new 52-week highs or lows on the New York Stock Exchange.
- Why watch it: The number of stocks hitting new highs or lows can signal whether bulls or bears are driving market sentiment—whether the overall market is trending up or down. In a healthy market, fewer than 50 stocks per day on the NYSE sink to new lows, says Stack. One hundred in a day could be a temporary blip. But if you see 100 per day over several weeks, it’s a sign that bearish leadership is building.
- What it says now: Aside from a spike in February, new lows have hovered between 20 and 40 in 2018. But note that new highs typically peak one year, on average, prior to market tops. The peak for new highs in the current market was in December 2016.
QUIZ: Test Your Bear Market Knowledge

Housing Starts
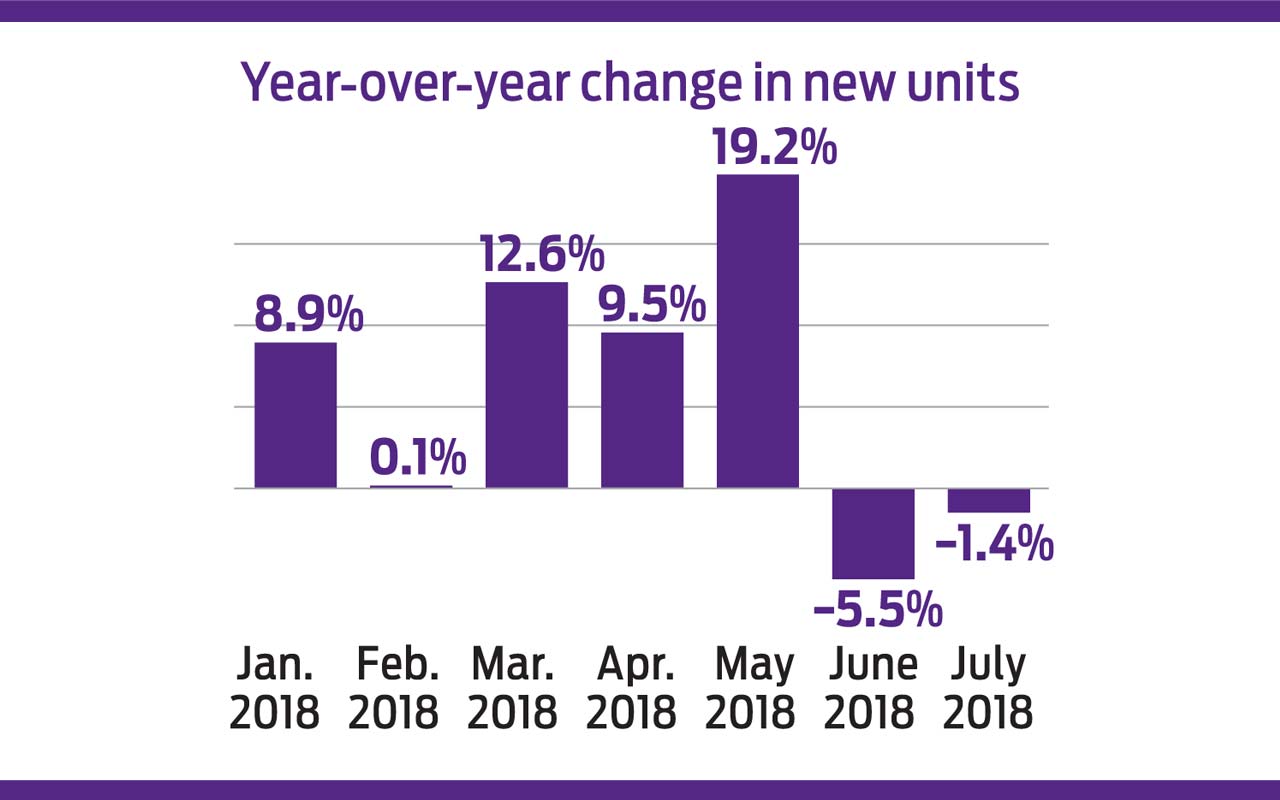
- The indicator: The monthly report from the U.S. Census Bureau that tallies housing starts—the number of new homes breaking ground—compared with the same month a year ago.
- Why watch it: Housing starts indicate economic strength. “Who is going to buy a house if they’re not certain they’ll keep their job?” says Sam Stovall, chief strategist at investment research firm CFRA. Within three months of every recession since 1960, housing starts have logged a double-digit decline compared with the same month in the previous year. Average prerecession drop: 25%.
- What it says now: June figures show a 1.4% dip year-over-year, on top of a 5.5% decline a month earlier.

The Fed & Inflation
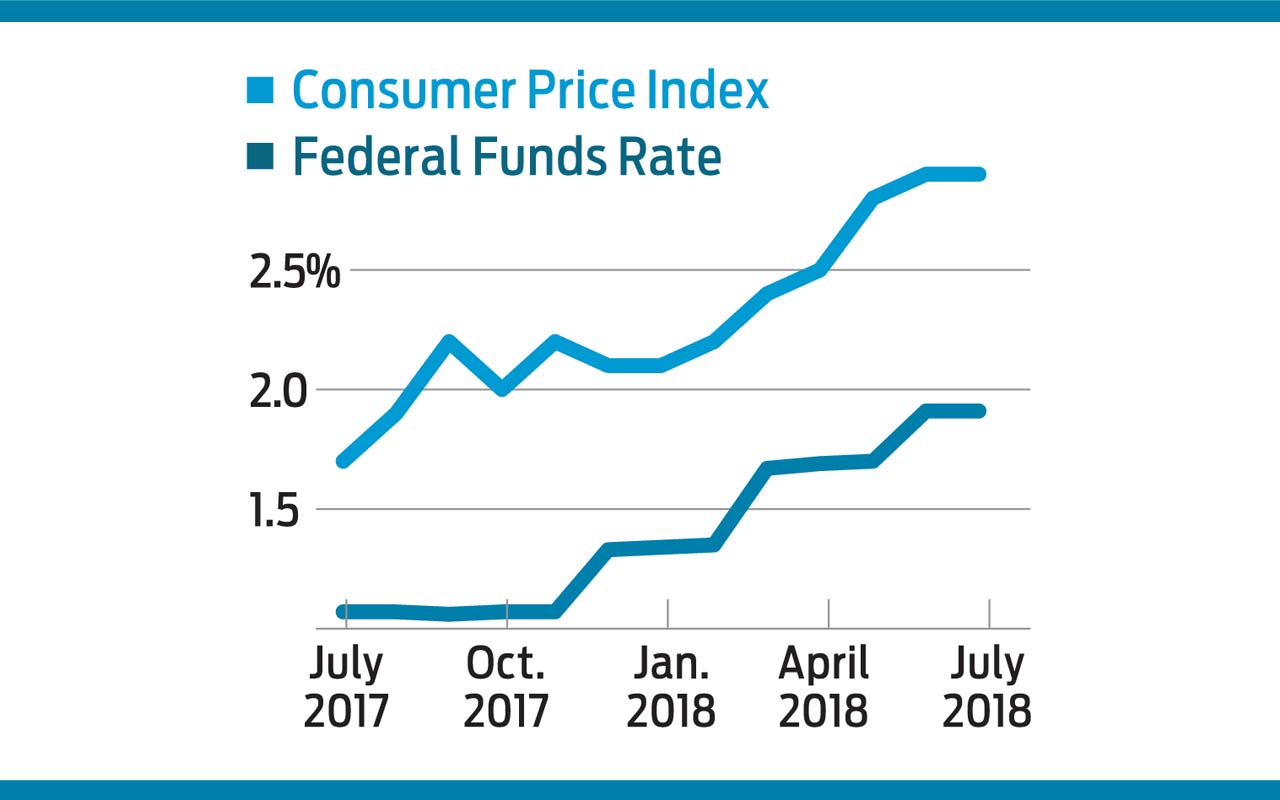
- The indicators: The Consumer Price Index, a measure of inflation, and the federal funds rate—the interest rate, set by the Federal Reserve, at which banks lend each other money overnight.
- Why watch them: Historically, bear markets have begun when the fed funds rate far exceeds inflation, says Stovall. Since 1959, the market has entered bear territory when the fed funds rate exceeds inflation by 2.7 percentage points, on average.
- What they say now: At a current annual rate of 2.7%, inflation exceeds the fed funds rate by less than a percentage point. But Stovall expects inflation to fall below the fed funds rate by the third quarter of 2019, as the Fed continues to hike rates.
Profit and prosper with the best of Kiplinger's advice on investing, taxes, retirement, personal finance and much more. Delivered daily. Enter your email in the box and click Sign Me Up.

Ryan joined Kiplinger in the fall of 2013. He wrote and fact-checked stories that appeared in Kiplinger's Personal Finance magazine and on Kiplinger.com. He previously interned for the CBS Evening News investigative team and worked as a copy editor and features columnist at the GW Hatchet. He holds a BA in English and creative writing from George Washington University.
-
 Dow Adds 1,206 Points to Top 50,000: Stock Market Today
The S&P 500 and Nasdaq also had strong finishes to a volatile week, with beaten-down tech stocks outperforming.
-
 Ask the Tax Editor: Federal Income Tax Deductions
Ask the Editor In this week's Ask the Editor Q&A, Joy Taylor answers questions on federal income tax deductions
-
 States With No-Fault Car Insurance Laws (and How No-Fault Car Insurance Works)
A breakdown of the confusing rules around no-fault car insurance in every state where it exists.
-
 The U.S. Economy Will Gain Steam This Year
The Kiplinger Letter The Letter editors review the projected pace of the economy for 2026. Bigger tax refunds and resilient consumers will keep the economy humming in 2026.
-
 Trump Reshapes Foreign Policy
The Kiplinger Letter The President starts the new year by putting allies and adversaries on notice.
-
 Congress Set for Busy Winter
The Kiplinger Letter The Letter editors review the bills Congress will decide on this year. The government funding bill is paramount, but other issues vie for lawmakers’ attention.
-
 The Kiplinger Letter's 10 Forecasts for 2026
The Kiplinger Letter Here are some of the biggest events and trends in economics, politics and tech that will shape the new year.
-
 Special Report: The Future of American Politics
The Kiplinger Letter The Political Trends and Challenges that Will Define the Next Decade
-
 What to Expect from the Global Economy in 2026
The Kiplinger Letter Economic growth across the globe will be highly uneven, with some major economies accelerating while others hit the brakes.
-
 Shoppers Hit the Brakes on EV Purchases After Tax Credits Expire
The Letter Electric cars are here to stay, but they'll have to compete harder to get shoppers interested without the federal tax credit.
-
 The Economy on a Knife's Edge
The Letter GDP is growing, but employers have all but stopped hiring as they watch how the trade war plays out.
