America’s Yield Curve Panic Is Overdone
Financial pundits’ consensus about interest rates is off the mark.


Profit and prosper with the best of Kiplinger's advice on investing, taxes, retirement, personal finance and much more. Delivered daily. Enter your email in the box and click Sign Me Up.
You are now subscribed
Your newsletter sign-up was successful
Want to add more newsletters?

Delivered daily
Kiplinger Today
Profit and prosper with the best of Kiplinger's advice on investing, taxes, retirement, personal finance and much more delivered daily. Smart money moves start here.

Sent five days a week
Kiplinger A Step Ahead
Get practical help to make better financial decisions in your everyday life, from spending to savings on top deals.

Delivered daily
Kiplinger Closing Bell
Get today's biggest financial and investing headlines delivered to your inbox every day the U.S. stock market is open.

Sent twice a week
Kiplinger Adviser Intel
Financial pros across the country share best practices and fresh tactics to preserve and grow your wealth.

Delivered weekly
Kiplinger Tax Tips
Trim your federal and state tax bills with practical tax-planning and tax-cutting strategies.

Sent twice a week
Kiplinger Retirement Tips
Your twice-a-week guide to planning and enjoying a financially secure and richly rewarding retirement

Sent bimonthly.
Kiplinger Adviser Angle
Insights for advisers, wealth managers and other financial professionals.

Sent twice a week
Kiplinger Investing Weekly
Your twice-a-week roundup of promising stocks, funds, companies and industries you should consider, ones you should avoid, and why.

Sent weekly for six weeks
Kiplinger Invest for Retirement
Your step-by-step six-part series on how to invest for retirement, from devising a successful strategy to exactly which investments to choose.
The financial media seems to be up in arms about the flattening yield curve – the difference between short-term interest rates and long-term rates – and how it supposedly tells us that a recession is right around the corner.
There is a link between the two, but it’s not what everyone thinks, and now is not the time to panic.
What Is the Yield Curve?
The yield curve is a snapshot of interest rates for bonds due at various times in the future. A normal, or upward-sloping, yield curve tells us that short-term rates are lower than intermediate-term rates, and intermediate-term rates are lower than long-term rates.
From just $107.88 $24.99 for Kiplinger Personal Finance
Become a smarter, better informed investor. Subscribe from just $107.88 $24.99, plus get up to 4 Special Issues

Sign up for Kiplinger’s Free Newsletters
Profit and prosper with the best of expert advice on investing, taxes, retirement, personal finance and more - straight to your e-mail.
Profit and prosper with the best of expert advice - straight to your e-mail.
It makes sense that lenders want extra compensation for loaning money for longer periods of time. After all, they will be at risk longer.
However, keeping track of Treasury rates across the maturity spectrum is a tall order. That is why many people simplify things by watching the spread, or difference, between the rates on the two-year Treasury note and the 10-year Treasury note. It is the 2-10 spread that currently commands everyone’s attention.
The yield curve also tells us a little about Federal Reserve policies and the public’s expectations for inflation and growth. Short-term bonds, such as three-month Treasury bills, react a great deal to changes in the Fed’s moves. The two-year Treasury note reacts almost as much.
On the longer end of the curve, the 10-year note reacts more to inflation and growth expectations. That is why long-term rates can stay put even as the Fed starts to ratchet up short-term rates.
If we look at the 2-10 spread now, we will see that it’s historically very low, or narrow. While the Fed pushed up short-term rates, growth expectations seem to have stalled from their rousing 2017 performances.
The question is, “Does that mean recession is coming?”
The answer is, “Probably … but not for a while.”
One thing is for sure: “Probably” does not make for a compelling headline. It certainly won’t draw in readers the same way you could by pointing out that the last time the yield curve looked like this was just before the 2007-09 financial crisis and bear market.
What Happens Next?
The Fed knows it is caught in a tough situation. It knows it cannot use monetary policy to combat a recession if interest rates are already low. It also knows that raising rates will flatten the curve even more unless growth expands. So what can it do?
Well, it can change the rules of the game.
In the minutes following its June meeting, the Fed introduced a new yield curve formula – one that shows the curve to be upward-sloping and situation normal.
The new curve looks at the difference between the three-month rate and the expected rate in six quarters. In other words, it is the three-month/18-month spread. That difference is quite positive.
“Is it possible the Fed is desperately attempting to increase the monetary ammo available for the next recession?” questioned Michael Lebowitz, Partner at Real Investment Advice. He added, “The Fed has undue influence over the short-end of the curve,” suggesting that it does not want to leave the curve up to the public’s perceptions of growth.
Ironically, the reason for the change suggested by the Fed, according to Lebowitz, is that the Fed’s very own quantitative easing (QE) artificially repressed long-term rates compared to short-term rates.
Let’s take a look at the current yield curve in its traditional form.
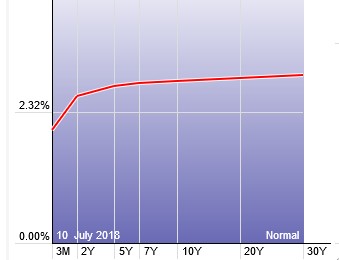
From this graphic, courtesy of StockCharts.com, we can see that most of the curve from seven-year to 30-year is quite flat. But in the region between three months and two years, the slope is quite positive. This is where the Fed’s new yield curve lives.
They can call it what they want. It does not change the fact that the 2-10 spread is exceptionally tight.
The consensus expectation is for two more Fed rate hikes this year, bringing 2017’s total to four. More hikes are expected next year. With the current state of the yield curve, the next move by the Fed would immediately push the curve negative. Short-term rates would exceed long-term rates, creating an “inverted yield curve.”
Inverted yield curves tend to precede recessions. It happened in 2000 and it happened in 2007, and each was followed by recession and a major bear market in stocks. If it happens this year, pundits will jump up on their soapboxes to proclaim the next recession is coming.
Why the Panic May Be Overdone
Mark Ungewitter, Senior Vice President Investment Officer at Charter Trust Company, says the presumed relationship of inverted yield curves with equity tops is based largely on three cases: 2007, 2000 and 1990.
However, the relationship was fuzzy in the 1970s, and in fact, the curve was not inverted at all at the 1987 top. When you factor that in, you realize that’s not very rigorous proof at all.
“The truth is that the curve generally goes from steep to flat or inverted as a bull market progresses,” says Ralph Vince, President of Vince Strategies LLC. “Declining long-term rates have historically been bullish, but so are rising short-term rates. And even when the yield curve flattens, it is not bearish until it reaches a critically flat or inverted state.”
The good news is that given the long period of such low interest rates in general, it could set the table for a protracted inverted curve before anything breaks.
In the 1980s, the late investment manager Martin Zweig famously said, “Don’t fight the tape and don’t fight the Fed.” To many, it meant that when the Fed starts to raise interest rates it is time to pull in their investment horns.
However, that misses half the quote. The tape, or the trend in the stock market, is still to the upside.
But again, what should investors do if and when the curve inverts?
The answer is not to do anything different then they are doing now. An inverted yield curve tends to lead recessions by as much as two years. And this dovetails with Vince’s argument that the flattening yield curve is actually bullish for stocks right now.
Even before the curve inverts, people are already buzzing with fear over the possibility. Danielle DiMartino Booth, CEO of Quill Intelligence and former Senior Economic Advisor at the Dallas Fed, noticed a huge spike in searches within Google Trends last month for terms similar to “inverted yield curve.” It rivaled the peak seen in December 2005. Apparently, sentiment has already reached extremes in fear.
From a market analyst point of view, extreme fear means people already think and act a certain way. And that means the supposed effect of their worries may not come to fruition.
In other words, an inverted yield curve may not mean very much this time around.
Booth added that the focus on the 2-10 spread has created a herd mentality. But the real issue she sees is that other inflation curves have already inverted. In May, U.S. small businesses reported the largest inversion on record between future and current wage inflation. And four regional Fed manufacturing surveys – New York, Philadelphia, Richmond and Dallas – have recently revealed inversions between future and current price inflation.
Not everything comes wrapped in a tight package.
Amid these inversions, and the flattening yield curve, the clock may already be ticking for a recession. And because of quantitative easing, the target for its onset is significantly shorter than two years.
Jason Goepfert, CEO of Sentimentrader.com, raised the contrary argument saying that just because the curve does not invert does not mean the economy won’t tip into recession. “Assumed economic laws are dangerous.”
The yield curve and recessions do seem to be linked, but there are no guarantees. There is no law stating that inversion and recession always occur together.
The takeaway? Any end to the current bull market in stocks or the start of the next recession is not indicated right now just because the yield curve is so flat. However, we can say that perhaps late 2019 might not be so pleasant.
Profit and prosper with the best of Kiplinger's advice on investing, taxes, retirement, personal finance and much more. Delivered daily. Enter your email in the box and click Sign Me Up.

-
 5 Vince Lombardi Quotes Retirees Should Live By
The iconic football coach's philosophy can help retirees win at the game of life.
-
 The $200,000 Olympic 'Pension' is a Retirement Game-Changer for Team USA
The donation by financier Ross Stevens is meant to be a "retirement program" for Team USA Olympic and Paralympic athletes.
-
 10 Cheapest Places to Live in Colorado
Property Tax Looking for a cozy cabin near the slopes? These Colorado counties combine reasonable house prices with the state's lowest property tax bills.
-
 If You'd Put $1,000 Into AMD Stock 20 Years Ago, Here's What You'd Have Today
Advanced Micro Devices stock is soaring thanks to AI, but as a buy-and-hold bet, it's been a market laggard.
-
 If You'd Put $1,000 Into UPS Stock 20 Years Ago, Here's What You'd Have Today
United Parcel Service stock has been a massive long-term laggard.
-
 If You'd Put $1,000 Into Lowe's Stock 20 Years Ago, Here's What You'd Have Today
Lowe's stock has delivered disappointing returns recently, but it's been a great holding for truly patient investors.
-
 If You'd Put $1,000 Into 3M Stock 20 Years Ago, Here's What You'd Have Today
MMM stock has been a pit of despair for truly long-term shareholders.
-
 If You'd Put $1,000 Into Coca-Cola Stock 20 Years Ago, Here's What You'd Have Today
Even with its reliable dividend growth and generous stock buybacks, Coca-Cola has underperformed the broad market in the long term.
-
 What Fed Rate Cuts Mean For Fixed-Income Investors
The Fed's rate-cutting campaign has the fixed-income market set for an encore of Q4 2024.
-
 If You Put $1,000 into Qualcomm Stock 20 Years Ago, Here's What You Would Have Today
Qualcomm stock has been a big disappointment for truly long-term investors.
-
 If You'd Put $1,000 Into Home Depot Stock 20 Years Ago, Here's What You'd Have Today
Home Depot stock has been a buy-and-hold banger for truly long-term investors.