10 Markets Where Housing Prices Have Fallen the Most
Let’s call it cause for optimism.

Profit and prosper with the best of Kiplinger's advice on investing, taxes, retirement, personal finance and much more. Delivered daily. Enter your email in the box and click Sign Me Up.
You are now subscribed
Your newsletter sign-up was successful
Want to add more newsletters?

Delivered daily
Kiplinger Today
Profit and prosper with the best of Kiplinger's advice on investing, taxes, retirement, personal finance and much more delivered daily. Smart money moves start here.

Sent five days a week
Kiplinger A Step Ahead
Get practical help to make better financial decisions in your everyday life, from spending to savings on top deals.

Delivered daily
Kiplinger Closing Bell
Get today's biggest financial and investing headlines delivered to your inbox every day the U.S. stock market is open.

Sent twice a week
Kiplinger Adviser Intel
Financial pros across the country share best practices and fresh tactics to preserve and grow your wealth.

Delivered weekly
Kiplinger Tax Tips
Trim your federal and state tax bills with practical tax-planning and tax-cutting strategies.

Sent twice a week
Kiplinger Retirement Tips
Your twice-a-week guide to planning and enjoying a financially secure and richly rewarding retirement

Sent bimonthly.
Kiplinger Adviser Angle
Insights for advisers, wealth managers and other financial professionals.

Sent twice a week
Kiplinger Investing Weekly
Your twice-a-week roundup of promising stocks, funds, companies and industries you should consider, ones you should avoid, and why.

Sent weekly for six weeks
Kiplinger Invest for Retirement
Your step-by-step six-part series on how to invest for retirement, from devising a successful strategy to exactly which investments to choose.
Let’s call it cause for optimism. After one of the worst housing collapses in history seven years ago, price declines have pretty much halted across every major metropolitan area in the U.S. Alas, these 10 U.S. Census metro areas with population of more than 250,000 still had small drops (-0.71% to -4%) in existing single-family home prices for the year ending June 30. Please take a look. Prices come from CoreLogic, a data and analytics company.
In many of these cities, the housing markets never really boomed nor busted. Most of them have ample supply of homes and relatively cheap prices, which should favor buyers. But many also have low wage bases, or declining or aging populations. Others rely on an employment sector that hasn't fully recovered from the recession. A couple of them are still burdened by a large share of distressed sales.
BENCHMARK STATISTICS NATIONALLY (ALL ARE MEDIANS): One-year change in home prices: 7.5%. Median home price: $185,038. Change in price since 2006 peak: -12.9%. Months' supply of homes: 5.5 months. Unemployment rate: 6.1% (seasonally adjusted), 6.3% (non-adjusted). City-specific unemployment rates that follow are non-adjusted. Rate of job growth: 1.8%. Distressed sales: 15.5%.
All home-price data is for existing single-family homes only (including distressed sales) and comes from CoreLogic. Distressed sales statistics are from CoreLogic. Sales, supply and other market data come from national and regional associations of Realtors.
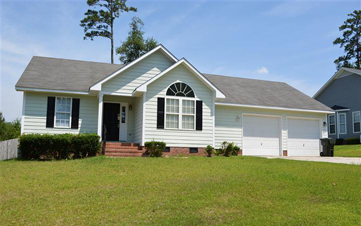
1. Fayetteville, N.C.
- One-year drop in home prices: -4%
- Median home price: $128,750
- Change in price since 2006 peak: -8.2%
- Distressed sales: 15.5%
- Months' supply of inventory: 11.1
- Unemployment rate: 7.5%
- Rate of job growth: -0.7%
Two years late to the housing crash, Fayetteville is running about three years behind the recovery in comparison to the country as a whole. Its housing market is insulated from national trends and uniquely defined by the huge presence of Fort Bragg, located northwest of the city.
When this market busted in 2008, builders went on vacation for a couple of years, says Zan Monroe, with the Fayetteville Regional Association of Realtors. When they came back, they offered dramatically lower prices that appealed to younger military buyers and pulled them from the resale market. Over the past year, however, builder sales have fallen. The metro area has a six-month supply of newly constructed homes on the market, which is considered balanced between sellers and buyers. But almost a year’s supply of existing homes for sale still makes this a buyer’s market.
See more features of this home and
see more listings in this area on
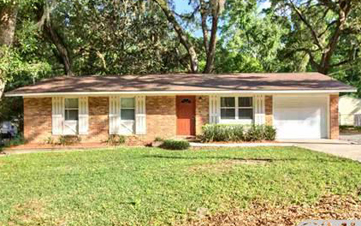
2. Tallahassee, Fla.
- One-year drop in home prices: -3.6%
- Median home price: $119,900
- Change in price since 2006 peak: -24.8%
- Distressed sales: 31.5%
- Months' supply of inventory: 8
- Unemployment rate: 5.8%
- Rate of job growth: 2.3%
The capital city of the Sunshine State doesn't attract out-of-state and international buyers and investors the way Florida's coastal cities do. Employment here is perking up, but most of the recovery has been in low-wage jobs in the service sector, which “may not generate enough income to support [demand in] the housing market,” says Carl Hudson, director of the Center for Real Estate Analytics at the Federal Reserve Bank of Atlanta. The metro area still has a significant inventory of houses going through foreclosure.
Homes are affordable, and buyers have plenty to choose from, with 8.6 months' supply. Home sales are up by about one-third from a year ago. On the upside: The state government provides steady employment, as do Florida State University and Florida A&M University. “This is a very stable environment,” says Greg Lane, of Timberlane Appraisal. “Growth is relatively slow but smart.”
See more features of this home and
see more listings in this area on
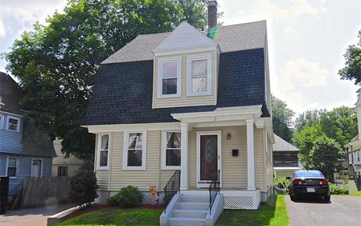
3. Worcester, Mass.
- One-year drop in home prices: -3.4%
- Median home price: $210,000
- Change in price since 2006 peak: -21.8%
- Distressed sales: 10.5%
- Months' supply of inventory: 7.2
- Unemployment rate: 6.1%
- Rate of job growth: 2.2%
This aging mill town in central Massachusetts is only 50 miles west of Boston. The 2006-07 housing collapse was steep here and all across the Bay State. But Worcester’s real estate market tumbled harder than Boston’s, and it hasn’t snapped back the way Beantown has. “It doesn’t have the same history [as Boston], it’s not a transit hub, and the jobs and support systems aren’t there,” says Cassidy Murphy, editorial director for The Warren Group, a New England-based real estate and banking data analysis firm. “Boston is where the jobs are, but Boston is too far away [for most commuters]," she says. The result: Worcester metro area housing prices continue to decline, with unsold inventory higher than in other metro areas in the U.S.
See more features of this home and
see more listings in this area on
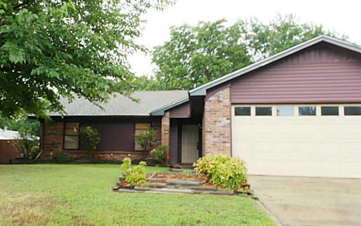
4. Fort Smith, Ark.
- One-year drop in home prices: -2.1%
- Median home price: $93,000
- Change in price since 2006 peak: -5.5%
- Distressed sales: 15.1%
- Months' supply of inventory: N/A
- Unemployment rate: 6.4%
- Rate of job growth: -0.2%
Located in the northwest corner of Arkansas along the Oklahoma border, Fort Smith's housing market has just plugged along for several years. Its manufacturing economy suffered mightily in the last recession. A local Whirlpool plant shut down, which hit other local support businesses hard, says Michael Pakko, an economist at the University of Arkansas at Little Rock. Of the state's three metro areas, Fort Smith is the only one that has lost population, albeit slightly, during the first half of this decade. So the housing market has seen reduced demand for existing homes and little demand for new construction.
See more features of this home and
see more listings in this area on
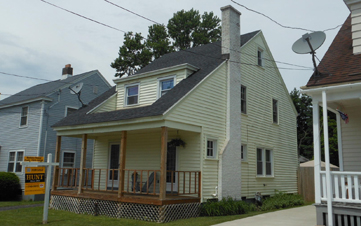
5. Utica-Rome, N.Y.
- One-year drop in home prices: -1.9%
- Median home price: $78,903
- Change in price since 2006 peak: -14.3%
- Distressed sales: 1.5%
- Months' supply of inventory: 11.3, Oneida; 20.2, Herkimer
- Unemployment rate: 6.2%
- Rate of job growth: 0.5%
This housing market in Upstate New York never really boomed or busted. Utica continues to suffer from a decades-long economic decline, an aging of population, and unlike most of Upstate, it has seen no bounce-back in employment from the Great Recession. The result is weak demand for housing and a supply of homes that harks back to bust days in hard-hit parts of the country: 11.3 months' supply in Oneida County and 20.2 months in Herkimer County. The median home price here is one of the lowest in the nation.
See more features of this home and
see more listings in this area on
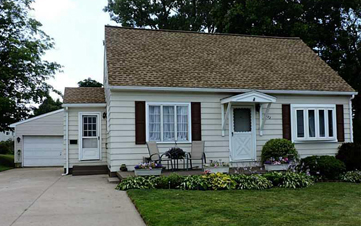
6. Erie, Pa.
- One-year drop in home prices: -1.4%
- Median home price: $107,600
- Change in price since 2006 peak: -8.5%
- Distressed sales: 11%
- Months' supply of inventory: 2.1
- Unemployment rate: 6%
- Rate of job growth: 1.2%
Much like Utica, the story of Erie’s housing market hinges on local economic stasis. Like many smaller Great Lakes (as well as Midwestern) cities with economies dependent on manufacturing, Erie has yet to fully recover the jobs it lost since the peak of the business cycle in 2007, and average weekly wages have been falling since 2012. Plus, Erie has experienced population loss over the past decade, and a high percentage of its residents are elderly or disabled. "On the demand side, that isn't a recipe for strong appreciation in home prices," says Guhan Venkatu, a Pittsburgh-based economist with the Federal Reserve Bank of Cleveland. On the supply side, much of its housing stock is older, in need of repairs and not worth the expense of rehabbing.
See more features of this home and
see more listings in this area on
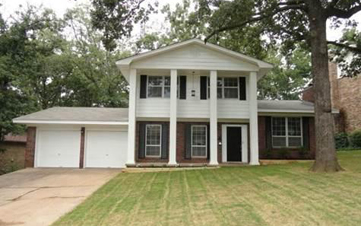
7. Little Rock, Ark.
- One-year drop in home prices: -1.4%
- Median home price: $140,500
- Change in price since 2006 peak: -2.9%
- Distressed sales: 9.4%
- Months' supply of inventory: 8.7
- Unemployment rate: 5.8%Rate of job growth: 1.2%State government and health care jobs kept the economy of Arkansas’s state capital relatively healthy during the Great Recession, says Michael Pakko, an economist at the University of Arkansas at Little Rock. So the metro area housing market didn't suffer quite as much as the rest of the state through the downturn, he adds. But it hasn't seen a big rebound, either. The metro area's level of employment (and the state's) is about where it was at the beginning of the recession. While the economy and home prices have been fairly stable, supply here strongly favors buyers (8.7 months' supply in June).
See more features of this home and
see more listings in this area on
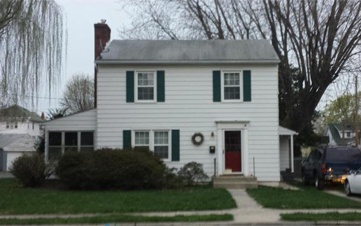
8. Hagerstown, Md.
- One-year drop in home prices: -1.3%
- Median home price: $133,750
- Change in price since 2006 peak: -32.7%
- Distressed sales: 23.9%
- Months' supply of inventory: 7.2
- Unemployment rate: 6.5%
- Rate of job growth: -0.6%
Job growth in Hagerstown has been slow. In nearby Martinsburg, many residents commute to jobs in Washington, D.C., but decreases in federal spending over the past year have depressed employment and demand for homes. (One bright spot: Martinsburg recently landed a Macy's fulfillment center with 800 employees.)
Nancy Allen, president-elect of the Pen-Mar Regional Association of Realtors, says that inventory has risen in Hagerstown, with foreclosures still coming to market and competing with traditional home sellers for limited buyers (more than half of the homes in Hagerstown are rental units).With still-strict requirements for getting a mortgage, many home seekers are "right on the edge" and can't quite qualify to borrow for a home, Allen adds.
Home sales in Hagerstown are up by one-fourth from a year ago. Possibly reflecting investors’ interest in distressed properties that they can rent out, Martinsburg, sales are up by a modest 2.1% from last year.
See more features of this home and
see more listings in this area on
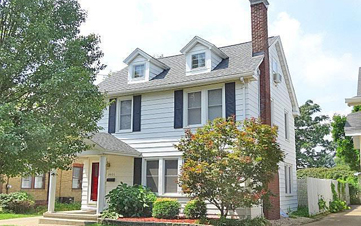
9. Peoria, Ill.
- One-year drop in home prices: -1%
- Median home price: $116,000
- Change in price since 2006 peak: -9.7%
- Distressed sales: 9.9%
- Months' supply of inventory: 5
- Unemployment rate: 7.3%
- Rate of job growth: -1.4%
Located midway between Chicago and St. Louis, Peoria's economic mainstays are manufacturing, agribusiness and health care. Global giant Caterpillar is headquartered here and is the largest employer. But the company had major layoffs in 2009 and 2013. While employment in manufacturing and local consumer confidence have yet to fully recover, health care has regained all its lost jobs, and a local index of business and economic indicators is on the upswing so far in 2014. That should improve demand for housing.
Home sales in the metro area have increased by 20% in the past year, and the months' supply of homes (5 months) is balanced between buyers and sellers. Homes here are affordable, especially smaller homes on smaller lots in Peoria proper, which appeal to young professionals and first-time home buyers, says Sally Hanley, of the Peoria-based Economic Development Council for Central Illinois. Smaller, rural communities in the outlying counties of Tazewell and Woodford are seeing spurts of home building.
See more features of this home and
see more listings in this area on
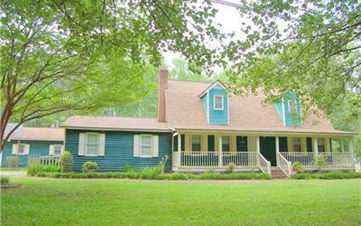
10. Durham-Chapel Hill, N.C.
- One-year drop in home prices: -0.7%
- Median home price: $197,500
- Change in price since 2006 peak: -3.7%
- Distressed sales: 11.3%
- Months' supply of inventory: 4.8, Durham; 4.5, Wake; 7.9, Orange
- Unemployment rate: 5.1%
- Rate of job growth: 1.5%
Anchoring two corners of the Research Triangle, the Durham-Chapel Hill metro area saw steady gains in home prices, particularly from late 2012 through the early spring of 2013, as home buyers jumped to take advantage of low interest rates. But over the past year, that growth has tapered off, and prices flattened. Sales fell (-4.5% in Durham County and -13.6% in Orange County in June). Supply in Durham is balanced between buyers and sellers (with 4.8 months' supply), but buyers rule in Orange County (with 7.9 months' supply).
On the demand side, the economy of the Triangle region (including Raleigh) is adding workers, driven by the University of North Carolina at Chapel Hill, Duke University and the tech, biotech and pharmaceutical industries. The area has gained enough new jobs to replace those lost during the recession.
See more features of this home and
see more listings in this area on
Profit and prosper with the best of Kiplinger's advice on investing, taxes, retirement, personal finance and much more. Delivered daily. Enter your email in the box and click Sign Me Up.

-
 How Much It Costs to Host a Super Bowl Party in 2026
Hosting a Super Bowl party in 2026 could cost you. Here's a breakdown of food, drink and entertainment costs — plus ways to save.
-
 3 Reasons to Use a 5-Year CD As You Approach Retirement
A five-year CD can help you reach other milestones as you approach retirement.
-
 Your Adult Kids Are Doing Fine. Is It Time To Spend Some of Their Inheritance?
If your kids are successful, do they need an inheritance? Ask yourself these four questions before passing down another dollar.
-
 12 Great Places to Retire in the Midwest
Places to live Here are our retirement picks in the 12 midwestern states.
-
 15 Cheapest Small Towns to Live In
The cheapest small towns might not be for everyone, but their charms can make them the best places to live for plenty of folks.
-
 Best Cold Weather Places to Retire
Places to live Some like it hot; others, not so much. Here are the 12 best places to retire if you can't stand the heat.
-
 The 24 Cheapest Places To Retire in the US
When you're trying to balance a fixed income with an enjoyable retirement, the cost of living is a crucial factor to consider. Is your city the best?
-
 The Six Best Places to Retire in New England
places to live Thinking about a move to New England for retirement? Here are the best places to land for quality of life, affordability and other criteria.
-
 Best Cold Weather Places to Retire
places to live Some like it hot; others not so much. Here are the 12 best places to retire if you can't stand the heat.
-
 15 Ways to Prepare Your Home for Winter
home There are many ways to prepare your home for winter, which will help keep you safe and warm and save on housing and utility costs.
-
 5 Great Places to Buy a Vacation Home
Want a vacation home for remote work or a fun getaway? Here are locations with median prices under $500K.


