Bond Advice for Today's Market: Think Big Picture
A bad day for stocks is often worse than a bad YEAR for bonds. Investors need to remember that right about now.


Profit and prosper with the best of Kiplinger's advice on investing, taxes, retirement, personal finance and much more. Delivered daily. Enter your email in the box and click Sign Me Up.
You are now subscribed
Your newsletter sign-up was successful
Want to add more newsletters?

Delivered daily
Kiplinger Today
Profit and prosper with the best of Kiplinger's advice on investing, taxes, retirement, personal finance and much more delivered daily. Smart money moves start here.

Sent five days a week
Kiplinger A Step Ahead
Get practical help to make better financial decisions in your everyday life, from spending to savings on top deals.

Delivered daily
Kiplinger Closing Bell
Get today's biggest financial and investing headlines delivered to your inbox every day the U.S. stock market is open.

Sent twice a week
Kiplinger Adviser Intel
Financial pros across the country share best practices and fresh tactics to preserve and grow your wealth.

Delivered weekly
Kiplinger Tax Tips
Trim your federal and state tax bills with practical tax-planning and tax-cutting strategies.

Sent twice a week
Kiplinger Retirement Tips
Your twice-a-week guide to planning and enjoying a financially secure and richly rewarding retirement

Sent bimonthly.
Kiplinger Adviser Angle
Insights for advisers, wealth managers and other financial professionals.

Sent twice a week
Kiplinger Investing Weekly
Your twice-a-week roundup of promising stocks, funds, companies and industries you should consider, ones you should avoid, and why.

Sent weekly for six weeks
Kiplinger Invest for Retirement
Your step-by-step six-part series on how to invest for retirement, from devising a successful strategy to exactly which investments to choose.
There is an old joke that some statisticians tell, that “a person with their head in an oven and their feet in the freezer is comfortable — on average.” Statisticians are not known for their sense of humor (clearly), but the joke is an effective warning about some of the shortcomings of relying on averages.
Statistically, a simple average camouflages extremes within its sample data. And, while the statistician’s joke is somewhat extreme, it is no less extreme than the actual returns in the long-run average annual returns for stocks and bonds that set many investors’ return expectations.
What’s an 'average' annual return anyway?
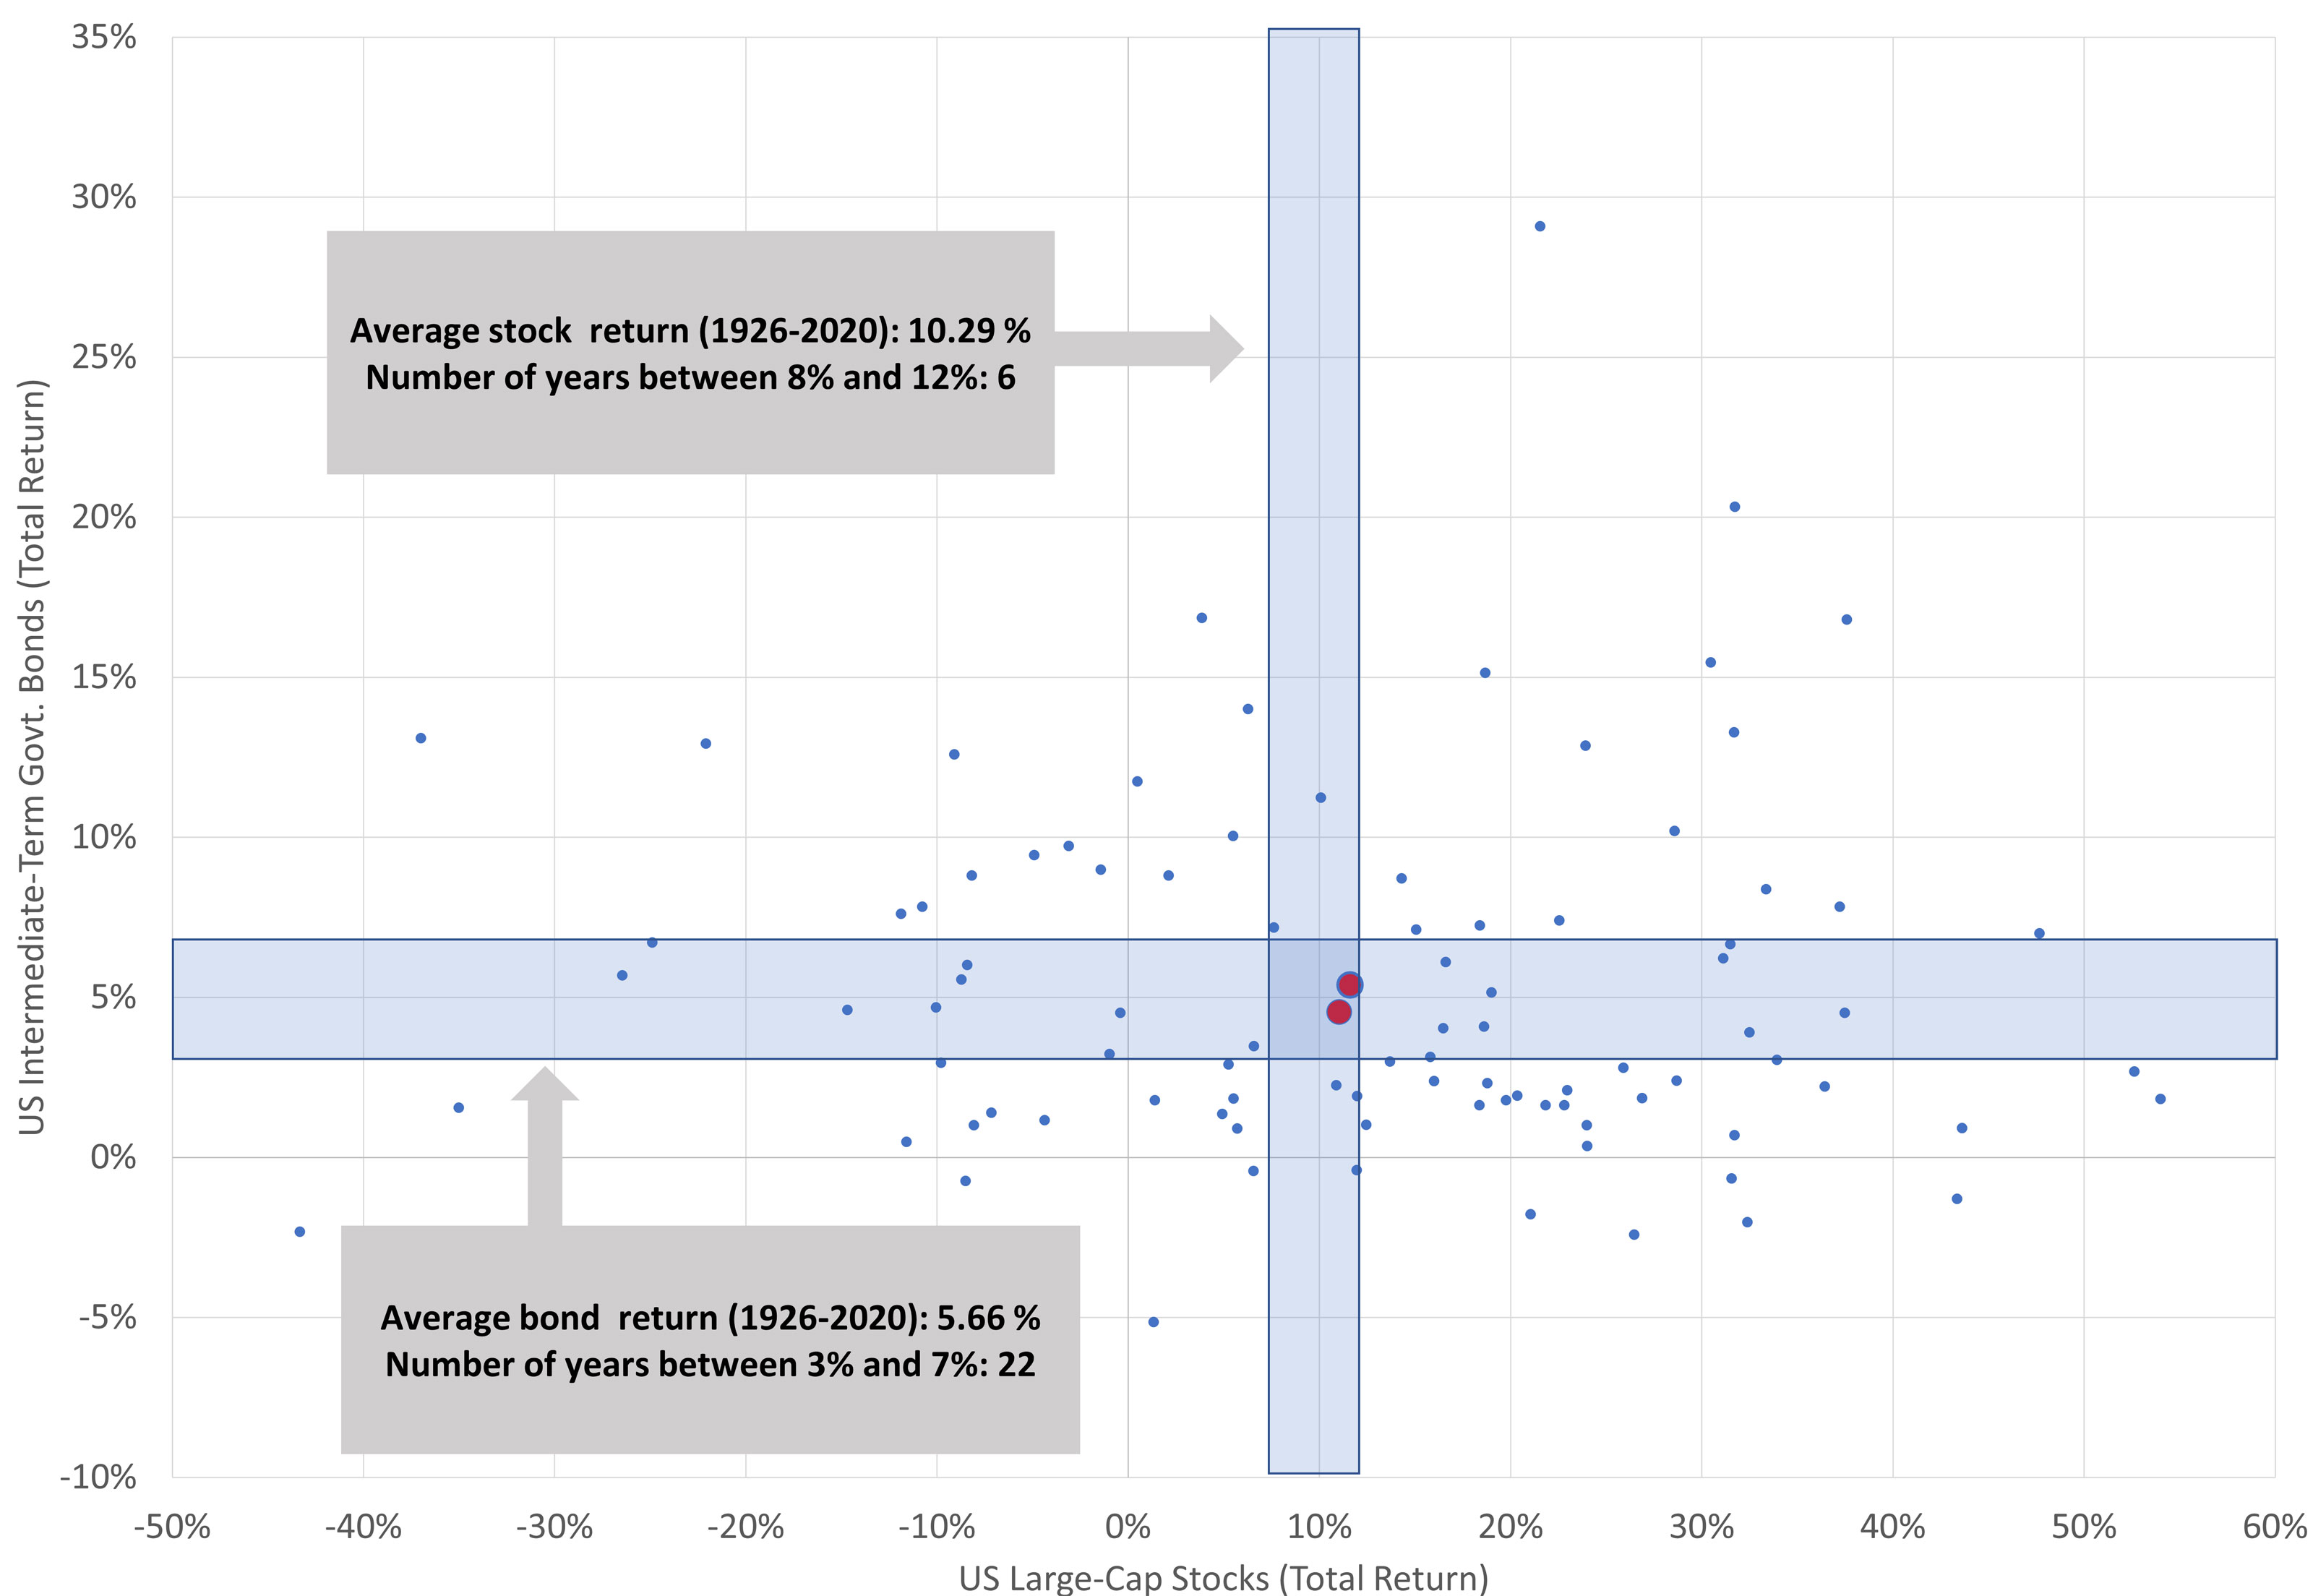
If quizzed, it is likely that many investors would estimate the average annualized returns for U.S. stocks and bonds to be about 10% and 5%, respectively. Those averages are composed of decades of returns and describe history perfectly. However, although they describe the average annualized returns, they are a far cry from the typical or "average" experience. In fact, in only two years from 1926 through 2020 did both the stock and bond market deliver returns within 2% (+/-) of their historical averages (see Figure 1).
From just $107.88 $24.99 for Kiplinger Personal Finance
Become a smarter, better informed investor. Subscribe from just $107.88 $24.99, plus get up to 4 Special Issues

Sign up for Kiplinger’s Free Newsletters
Profit and prosper with the best of expert advice on investing, taxes, retirement, personal finance and more - straight to your e-mail.
Profit and prosper with the best of expert advice - straight to your e-mail.
Figure 1: Annual stock and bond returns, 1926-2020

In 2021, U.S. stocks gained 25.7%, while U.S. bonds lost 1.5%.* While it is fair to say that it was a great year for stocks, is it fair to say that it was a bad year for bonds because they didn’t return their 5.7%* average? Probably not. The only thing rarer than a year with “average” returns might be a year that investors appreciate their bond allocations amid a bull market for stocks.
For those of you thinking about abandoning bonds, here are some ideas that may help:
A bad day for stocks is often much worse than a bad year for bonds.
While investors prefer gains to losses, they also prefer small losses to big losses. While far from being predictive, Figure 1 demonstrates that negative returns in bonds have tended to be both infrequent and modest. In fact, the bond market’s worst annual return was a loss of 5.1% in 1994. However, the stocks of the S&P 500 index have posted daily losses that bad or worse 25 times since 1926.
Sometimes, the further the distance, the clearer the picture.
Often, it’s hard for investors to see the benefits that high-quality bonds can add to their portfolios, especially when the returns they are posting are modest — or even modestly negative. And today, concerns for higher interest rates due to higher-than-expected inflation are making it even more challenging for investors to ignore some pundits’ suggestions that holding bonds is a bad idea.
I was given a magnifying glass when I was young, and I started looking at everything through it. Eventually, I looked at the Sunday comics and realized that for all I saw, I wasn’t seeing everything. The cartoons were nothing but a variety of colored dots! Magazine photos, too. It made me wonder how much else I was missing because I wasn’t looking closely enough. Now, I realize that when I was close enough to see the dots, I missed the bigger picture – literally.
Similarly, the dots in Figure 1 paint a picture that’s easy to overlook when you’re too narrowly focused: The principal benefit of investment-grade bonds isn’t their frequency of positive returns but the infrequency of large, negative returns. And, yes, if the returns in Figure 1 were inflation-adjusted, the frequency of negative returns for both bonds and stocks would increase. However, that would not change what Figure 1 tells us: High-quality bonds in a portfolio can help moderate the volatility of stocks.
The bottom line: Keep your eye on the big picture.
A well-diversified portfolio can benefit from bonds: More likely than not, a bad year for bonds will be much better than a bad day for stocks. While that certainly won’t insure your portfolio against losses, it can certainly help moderate the losses when the markets turn intemperate.
Having a well-diversified portfolio that includes an allocation to high-quality bonds can help keep a bad day in the stock market from turning into a bad year for your portfolio.
* Stock performance as measured by the CRSP U.S. Total Market Index. Bond performance as measured by the Bloomberg U.S. Aggregate Float Adjusted Index. Bond average is a geometric mean return for the Ibbotson® SBBI® U.S. Intermediate-term (5-Year) Government Bonds (Total return).
Profit and prosper with the best of Kiplinger's advice on investing, taxes, retirement, personal finance and much more. Delivered daily. Enter your email in the box and click Sign Me Up.

Don Bennyhoff, CFA®, serves as the Chairman of the Investment Committee and Director of Investor Education at Liberty Wealth Advisors, a $1.7B RIA. An industry expert who spent over 22 years at The Vanguard Group, Don was a Founding Member of Vanguard’s Investment Strategy Group, and served as a Senior Investment Strategist.
-
 Ask the Tax Editor: Federal Income Tax Deductions
Ask the Editor In this week's Ask the Editor Q&A, Joy Taylor answers questions on federal income tax deductions
-
 States With No-Fault Car Insurance Laws (and How No-Fault Car Insurance Works)
A breakdown of the confusing rules around no-fault car insurance in every state where it exists.
-
 7 Frugal Habits to Keep Even When You're Rich
Some frugal habits are worth it, no matter what tax bracket you're in.
-
 For the 2% Club, the Guardrails Approach and the 4% Rule Do Not Work: Here's What Works Instead
For retirees with a pension, traditional withdrawal rules could be too restrictive. You need a tailored income plan that is much more flexible and realistic.
-
 Retiring Next Year? Now Is the Time to Start Designing What Your Retirement Will Look Like
This is when you should be shifting your focus from growing your portfolio to designing an income and tax strategy that aligns your resources with your purpose.
-
 I'm a Financial Planner: This Layered Approach for Your Retirement Money Can Help Lower Your Stress
To be confident about retirement, consider building a safety net by dividing assets into distinct layers and establishing a regular review process. Here's how.
-
 The 4 Estate Planning Documents Every High-Net-Worth Family Needs (Not Just a Will)
The key to successful estate planning for HNW families isn't just drafting these four documents, but ensuring they're current and immediately accessible.
-
 Love and Legacy: What Couples Rarely Talk About (But Should)
Couples who talk openly about finances, including estate planning, are more likely to head into retirement joyfully. How can you get the conversation going?
-
 How to Get the Fair Value for Your Shares When You Are in the Minority Vote on a Sale of Substantially All Corporate Assets
When a sale of substantially all corporate assets is approved by majority vote, shareholders on the losing side of the vote should understand their rights.
-
 How to Add a Pet Trust to Your Estate Plan: Don't Leave Your Best Friend to Chance
Adding a pet trust to your estate plan can ensure your pets are properly looked after when you're no longer able to care for them. This is how to go about it.
-
 Want to Avoid Leaving Chaos in Your Wake? Don't Leave Behind an Outdated Estate Plan
An outdated or incomplete estate plan could cause confusion for those handling your affairs at a difficult time. This guide highlights what to update and when.