A Better Way to Tell a Correction from a Bear Market?
You could go by the usual definition, but dive a little deeper into the market and you might get a better indication of what's going on before making any stock moves.


Profit and prosper with the best of Kiplinger's advice on investing, taxes, retirement, personal finance and much more. Delivered daily. Enter your email in the box and click Sign Me Up.
You are now subscribed
Your newsletter sign-up was successful
Want to add more newsletters?

Delivered daily
Kiplinger Today
Profit and prosper with the best of Kiplinger's advice on investing, taxes, retirement, personal finance and much more delivered daily. Smart money moves start here.

Sent five days a week
Kiplinger A Step Ahead
Get practical help to make better financial decisions in your everyday life, from spending to savings on top deals.

Delivered daily
Kiplinger Closing Bell
Get today's biggest financial and investing headlines delivered to your inbox every day the U.S. stock market is open.

Sent twice a week
Kiplinger Adviser Intel
Financial pros across the country share best practices and fresh tactics to preserve and grow your wealth.

Delivered weekly
Kiplinger Tax Tips
Trim your federal and state tax bills with practical tax-planning and tax-cutting strategies.

Sent twice a week
Kiplinger Retirement Tips
Your twice-a-week guide to planning and enjoying a financially secure and richly rewarding retirement

Sent bimonthly.
Kiplinger Adviser Angle
Insights for advisers, wealth managers and other financial professionals.

Sent twice a week
Kiplinger Investing Weekly
Your twice-a-week roundup of promising stocks, funds, companies and industries you should consider, ones you should avoid, and why.

Sent weekly for six weeks
Kiplinger Invest for Retirement
Your step-by-step six-part series on how to invest for retirement, from devising a successful strategy to exactly which investments to choose.
The standard definition of a correction is a 10% market decline, while a bear market is a 20% decline. These are simple definitions … I take a different view.
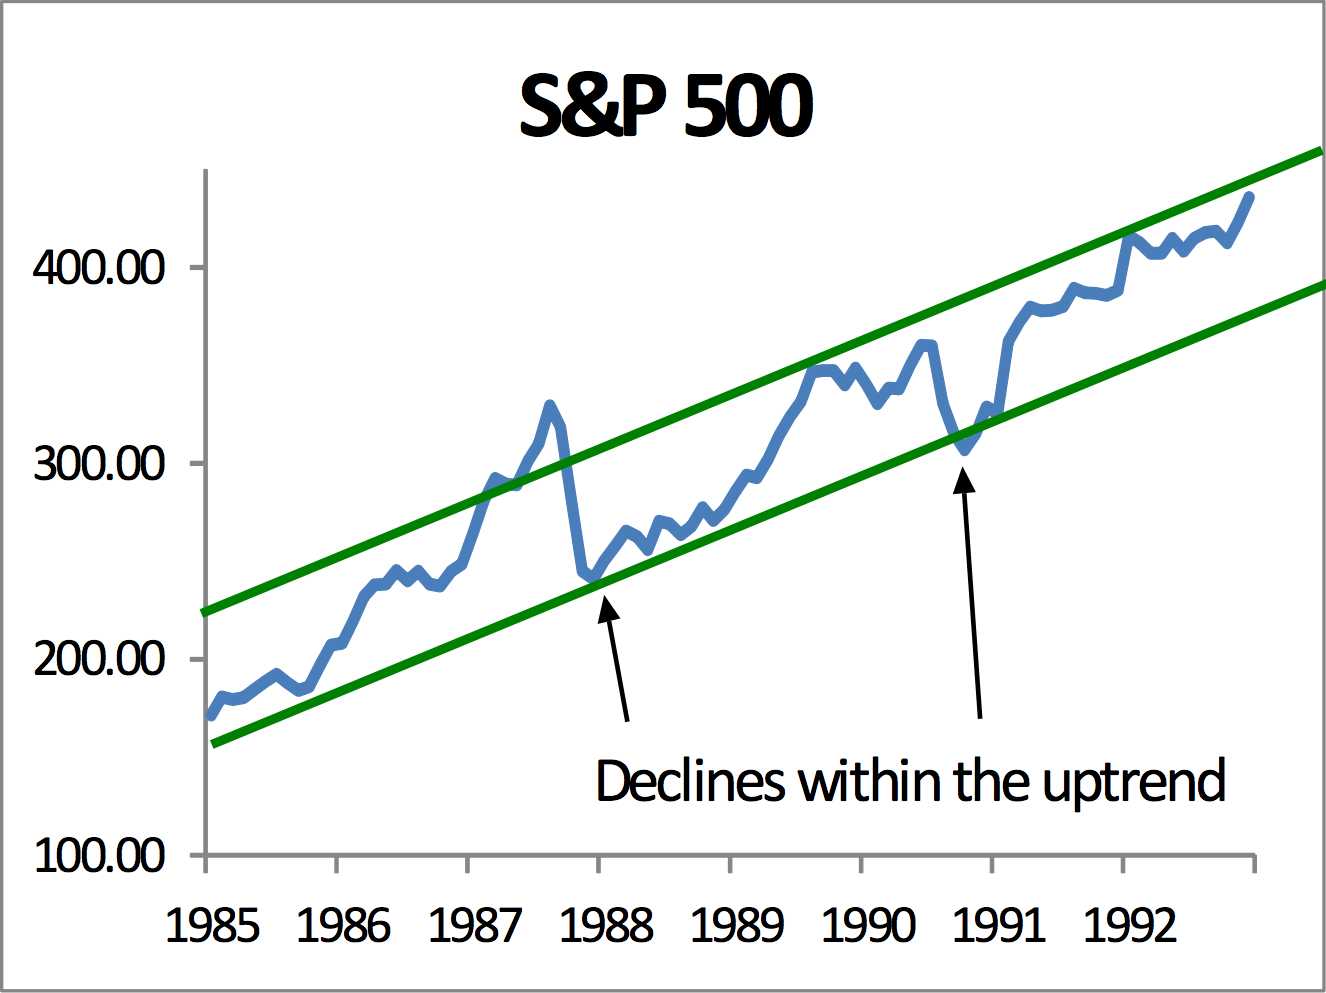
At Cornerstone, we view a correction as a significant decline within an up trend. The key here is that the up trend continues after the correction is over. Two examples are the crash in 1987 and the correction of 1990. In both cases, the market fell 20% or more, yet they recovered quickly and the up trend continued.
As you can see in the chart below, the up trend (green lines) continued upward, but the market, (blue line) vacillated between the two green up trend lines. Since the declines did not reverse the trend, they were only corrections, however, since they were declines of over 20%, by the standard definition, they were called bear markets.
From just $107.88 $24.99 for Kiplinger Personal Finance
Become a smarter, better informed investor. Subscribe from just $107.88 $24.99, plus get up to 4 Special Issues

Sign up for Kiplinger’s Free Newsletters
Profit and prosper with the best of expert advice on investing, taxes, retirement, personal finance and more - straight to your e-mail.
Profit and prosper with the best of expert advice - straight to your e-mail.

Why is that significant? Buying the dip has been a successful strategy for investors over the past nine years. Corrections can be a buying opportunity, since the market is still in an up trend. Current positions do not need to be sold, again since the market is still in an up trend.
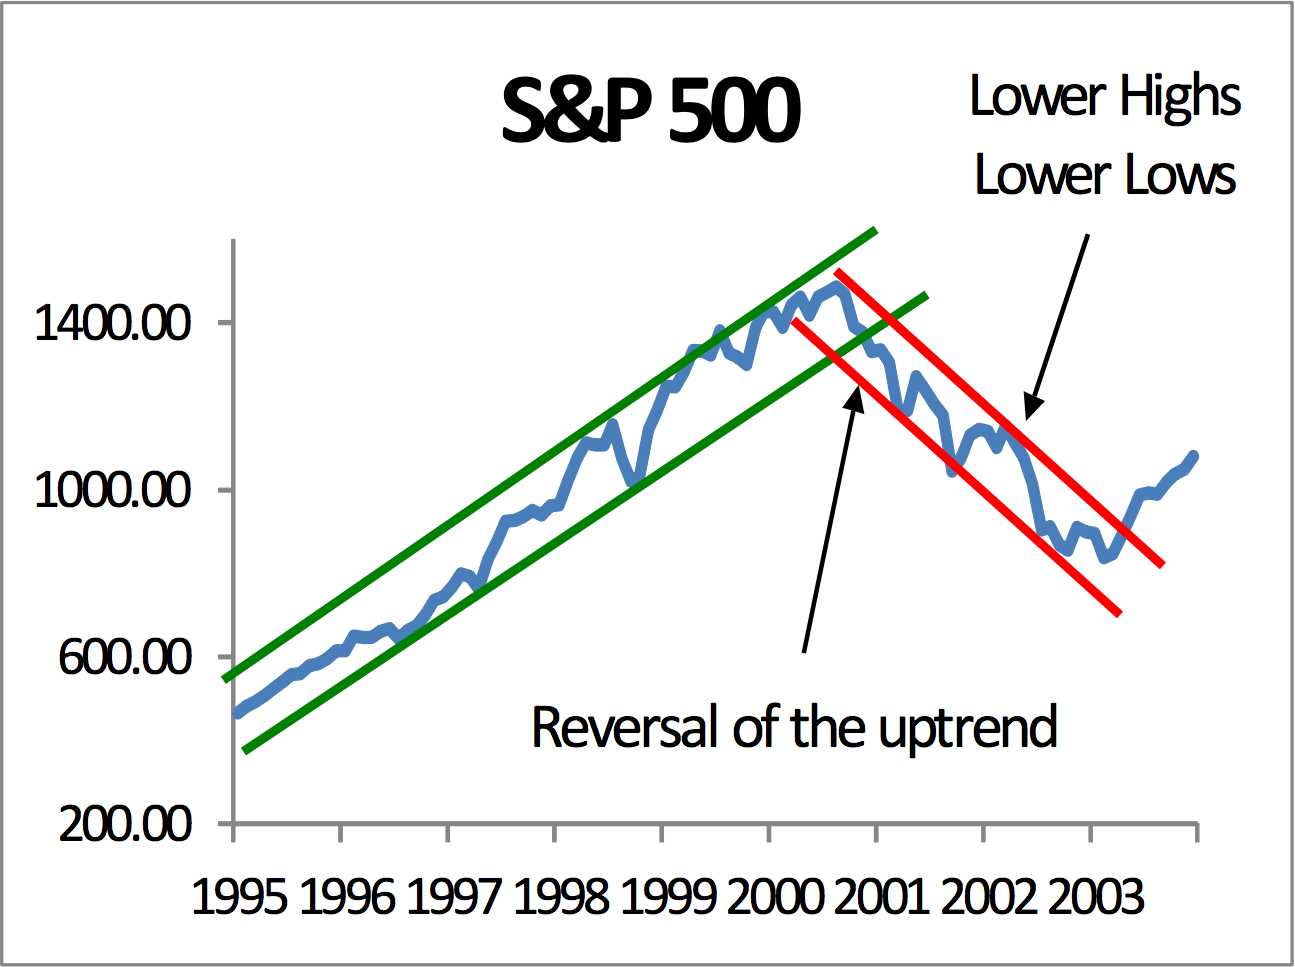
At Cornerstone, we define a bear market as the reversal of an up trend. This can be seen in 2000 and 2007. A reversal of an up trend is usually characterized by a chart with lower lows and lower highs. Since the lows keep going lower, the chart reverses trend, and an up trend starts to head down (red lines).

For investors, what that means is with a bear market, rallies are to be sold, and dips are not bought. As you can see from the chart, buying the dips only leads to lower lows. Selling rallies is the wise move in a bear market.
Once a chart breaks above the down trend and the lows start getting higher and the highs start getting higher, the bear market is over and the market has reversed into a bull market.
Why do markets peak, and how far can a bear market go? Overvaluation makes markets fragile. So the more overvalued, the more vulnerable it is to a correction or a bear market. Historically, bear markets (as defined by Cornerstone) did not bottom until valuations were extremely low. The price-to-earnings ratio of the market has hit single digits in the past at bear market bottoms. Today’s Shiller P/E is over 30.
How can you tell if a correction is on its way to becoming a bear market? You don’t know until the chart tells you. If after a decline, the market fails to return to its up trend, that is a sign that a bear market has begun.
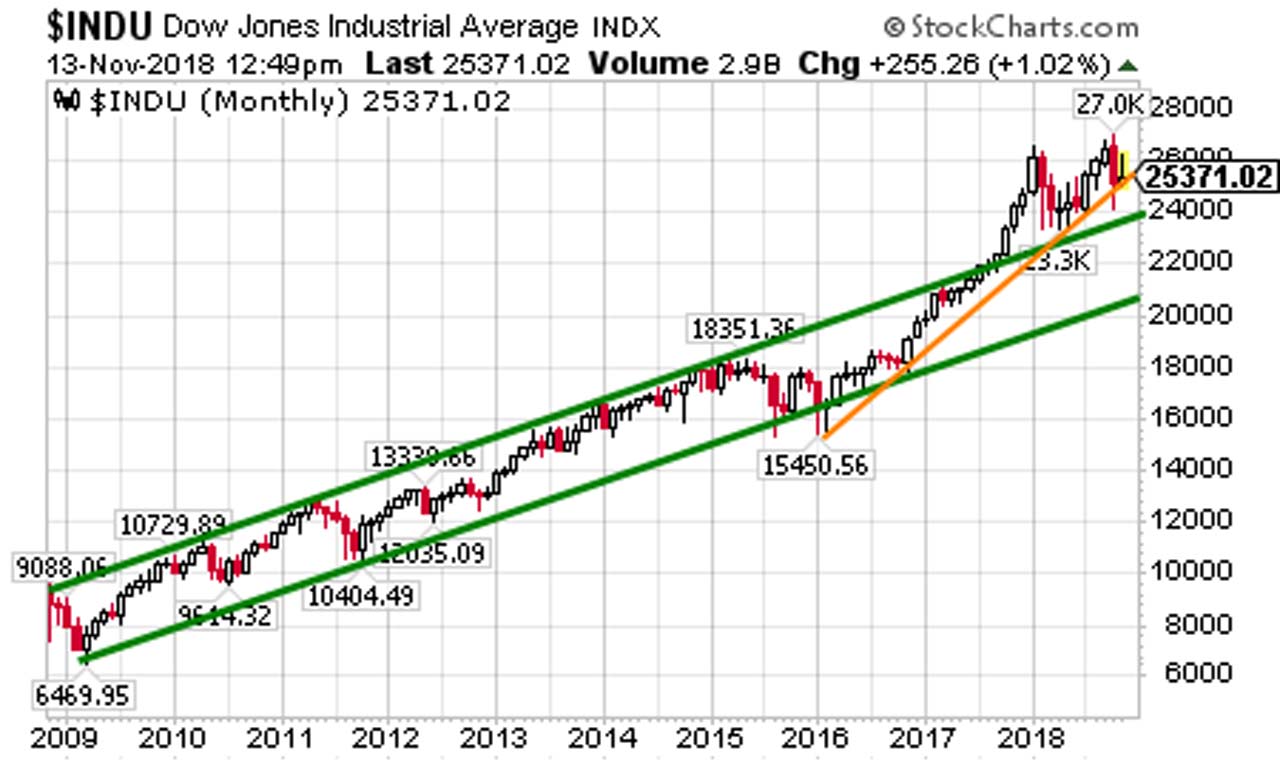
Where are we today? As you can see in the chart below, the market has not made lower lows, which means the first step in a bear market hasn’t happened yet. So, for now, the market is in a correction.

The green lines indicate the long-term up trend. The thin orange line indicates what some call the “Trump rally.” This refers to the market’s rise since President Trump was elected. On the Dow Jones, this Trump rally trend could be broken, and the market could drop a bit further, but it still has a ways to go before it even falls to the level of the top green line that marks the upper limits of the up trend. As long as it holds that trend line, and follows it up, the market would not have fallen into a bear.

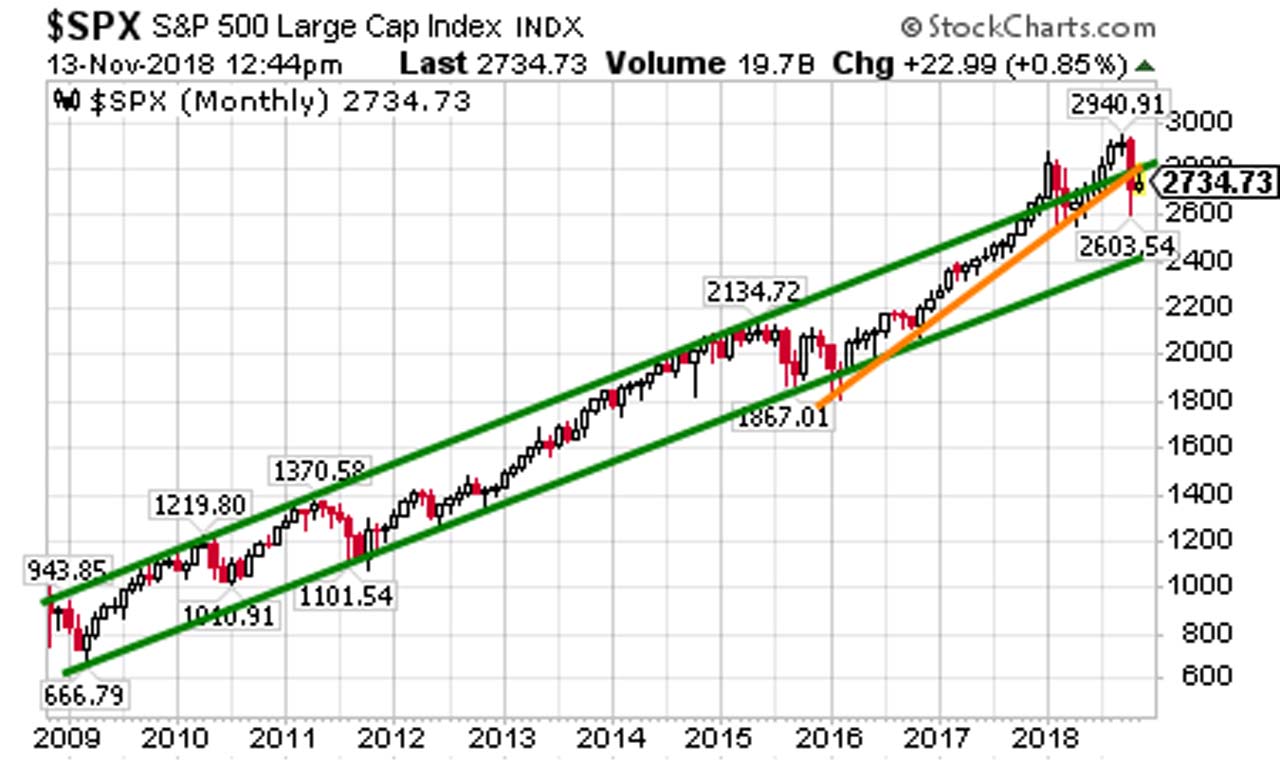
The S&P chart above is a little different. The upper end of the up trend channel and the Trump rally are hitting the same spot right now. So a failure of one means the failure of the other. As you can see by the chart, the S&P is currently slightly below each trend line.
Does this mean it’s the start of a bear market? Not yet. The first indicator would be if the low fell below the previous low from the 1st quarter of 2018. And then the subsequent rally would have to fail to make new highs, at least above the upper trendline. Then time will tell.
Watching if the lows go lower and the highs go lower are good signs the market is rolling into a bear. And especially if the market drops below the lower green up trend line.
In the meantime, it’s only a correction within an up trend, and should be treated as such, by holding onto quality investments and adding investments that have become oversold. Will it turn into a bear market? Only time will tell, so we are watching things closely and have strategies — such as selling into rallies, reducing equity exposure, and raising cash among others — for various outcomes.
Third-party posts do not reflect the views of Cantella & Co Inc. or Cornerstone Investment Services, LLC. Any links to third-party sites are believed to be reliable but have not been independently reviewed by Cantella & Co. Inc. or Cornerstone Investment Services, LLC. Securities offered through Cantella & Co., Inc., Member FINRA/SIPC. Advisory Services offered through Cornerstone Investment Services, LLC's RIA.
Profit and prosper with the best of Kiplinger's advice on investing, taxes, retirement, personal finance and much more. Delivered daily. Enter your email in the box and click Sign Me Up.

In 1999, John Riley established Cornerstone Investment Services to offer investors an alternative to Wall Street. He is unique among financial advisers for having passed the Series 86 and 87 exams to become a registered Research Analyst. Since breaking free of the crowd, John has been able to manage clients' money in a way that prepares them for the trends he sees in the markets and the surprises Wall Street misses.
-
 How Much It Costs to Host a Super Bowl Party in 2026
Hosting a Super Bowl party in 2026 could cost you. Here's a breakdown of food, drink and entertainment costs — plus ways to save.
-
 3 Reasons to Use a 5-Year CD As You Approach Retirement
A five-year CD can help you reach other milestones as you approach retirement.
-
 Your Adult Kids Are Doing Fine. Is It Time To Spend Some of Their Inheritance?
If your kids are successful, do they need an inheritance? Ask yourself these four questions before passing down another dollar.
-
 The 4 Estate Planning Documents Every High-Net-Worth Family Needs (Not Just a Will)
The key to successful estate planning for HNW families isn't just drafting these four documents, but ensuring they're current and immediately accessible.
-
 Love and Legacy: What Couples Rarely Talk About (But Should)
Couples who talk openly about finances, including estate planning, are more likely to head into retirement joyfully. How can you get the conversation going?
-
 How to Get the Fair Value for Your Shares When You Are in the Minority Vote on a Sale of Substantially All Corporate Assets
When a sale of substantially all corporate assets is approved by majority vote, shareholders on the losing side of the vote should understand their rights.
-
 How to Add a Pet Trust to Your Estate Plan: Don't Leave Your Best Friend to Chance
Adding a pet trust to your estate plan can ensure your pets are properly looked after when you're no longer able to care for them. This is how to go about it.
-
 Want to Avoid Leaving Chaos in Your Wake? Don't Leave Behind an Outdated Estate Plan
An outdated or incomplete estate plan could cause confusion for those handling your affairs at a difficult time. This guide highlights what to update and when.
-
 I'm a Financial Adviser: This Is Why I Became an Advocate for Fee-Only Financial Advice
Can financial advisers who earn commissions on product sales give clients the best advice? For one professional, changing track was the clear choice.
-
 I Met With 100-Plus Advisers to Develop This Road Map for Adopting AI
For financial advisers eager to embrace AI but unsure where to start, this road map will help you integrate the right tools and safeguards into your work.
-
 The Referral Revolution: How to Grow Your Business With Trust
You can attract ideal clients by focusing on value and leveraging your current relationships to create a referral-based practice.