Bond Basics: Riding the Yield Curve
The simple relationship between long- and short-term interest rates can tell you a lot about the bond market.


You are now subscribed
Your newsletter sign-up was successful
Want to add more newsletters?

Delivered daily
Kiplinger Today
Profit and prosper with the best of Kiplinger's advice on investing, taxes, retirement, personal finance and much more delivered daily. Smart money moves start here.

Sent five days a week
Kiplinger A Step Ahead
Get practical help to make better financial decisions in your everyday life, from spending to savings on top deals.

Delivered daily
Kiplinger Closing Bell
Get today's biggest financial and investing headlines delivered to your inbox every day the U.S. stock market is open.

Sent twice a week
Kiplinger Adviser Intel
Financial pros across the country share best practices and fresh tactics to preserve and grow your wealth.

Delivered weekly
Kiplinger Tax Tips
Trim your federal and state tax bills with practical tax-planning and tax-cutting strategies.

Sent twice a week
Kiplinger Retirement Tips
Your twice-a-week guide to planning and enjoying a financially secure and richly rewarding retirement

Sent bimonthly.
Kiplinger Adviser Angle
Insights for advisers, wealth managers and other financial professionals.

Sent twice a week
Kiplinger Investing Weekly
Your twice-a-week roundup of promising stocks, funds, companies and industries you should consider, ones you should avoid, and why.

Sent weekly for six weeks
Kiplinger Invest for Retirement
Your step-by-step six-part series on how to invest for retirement, from devising a successful strategy to exactly which investments to choose.
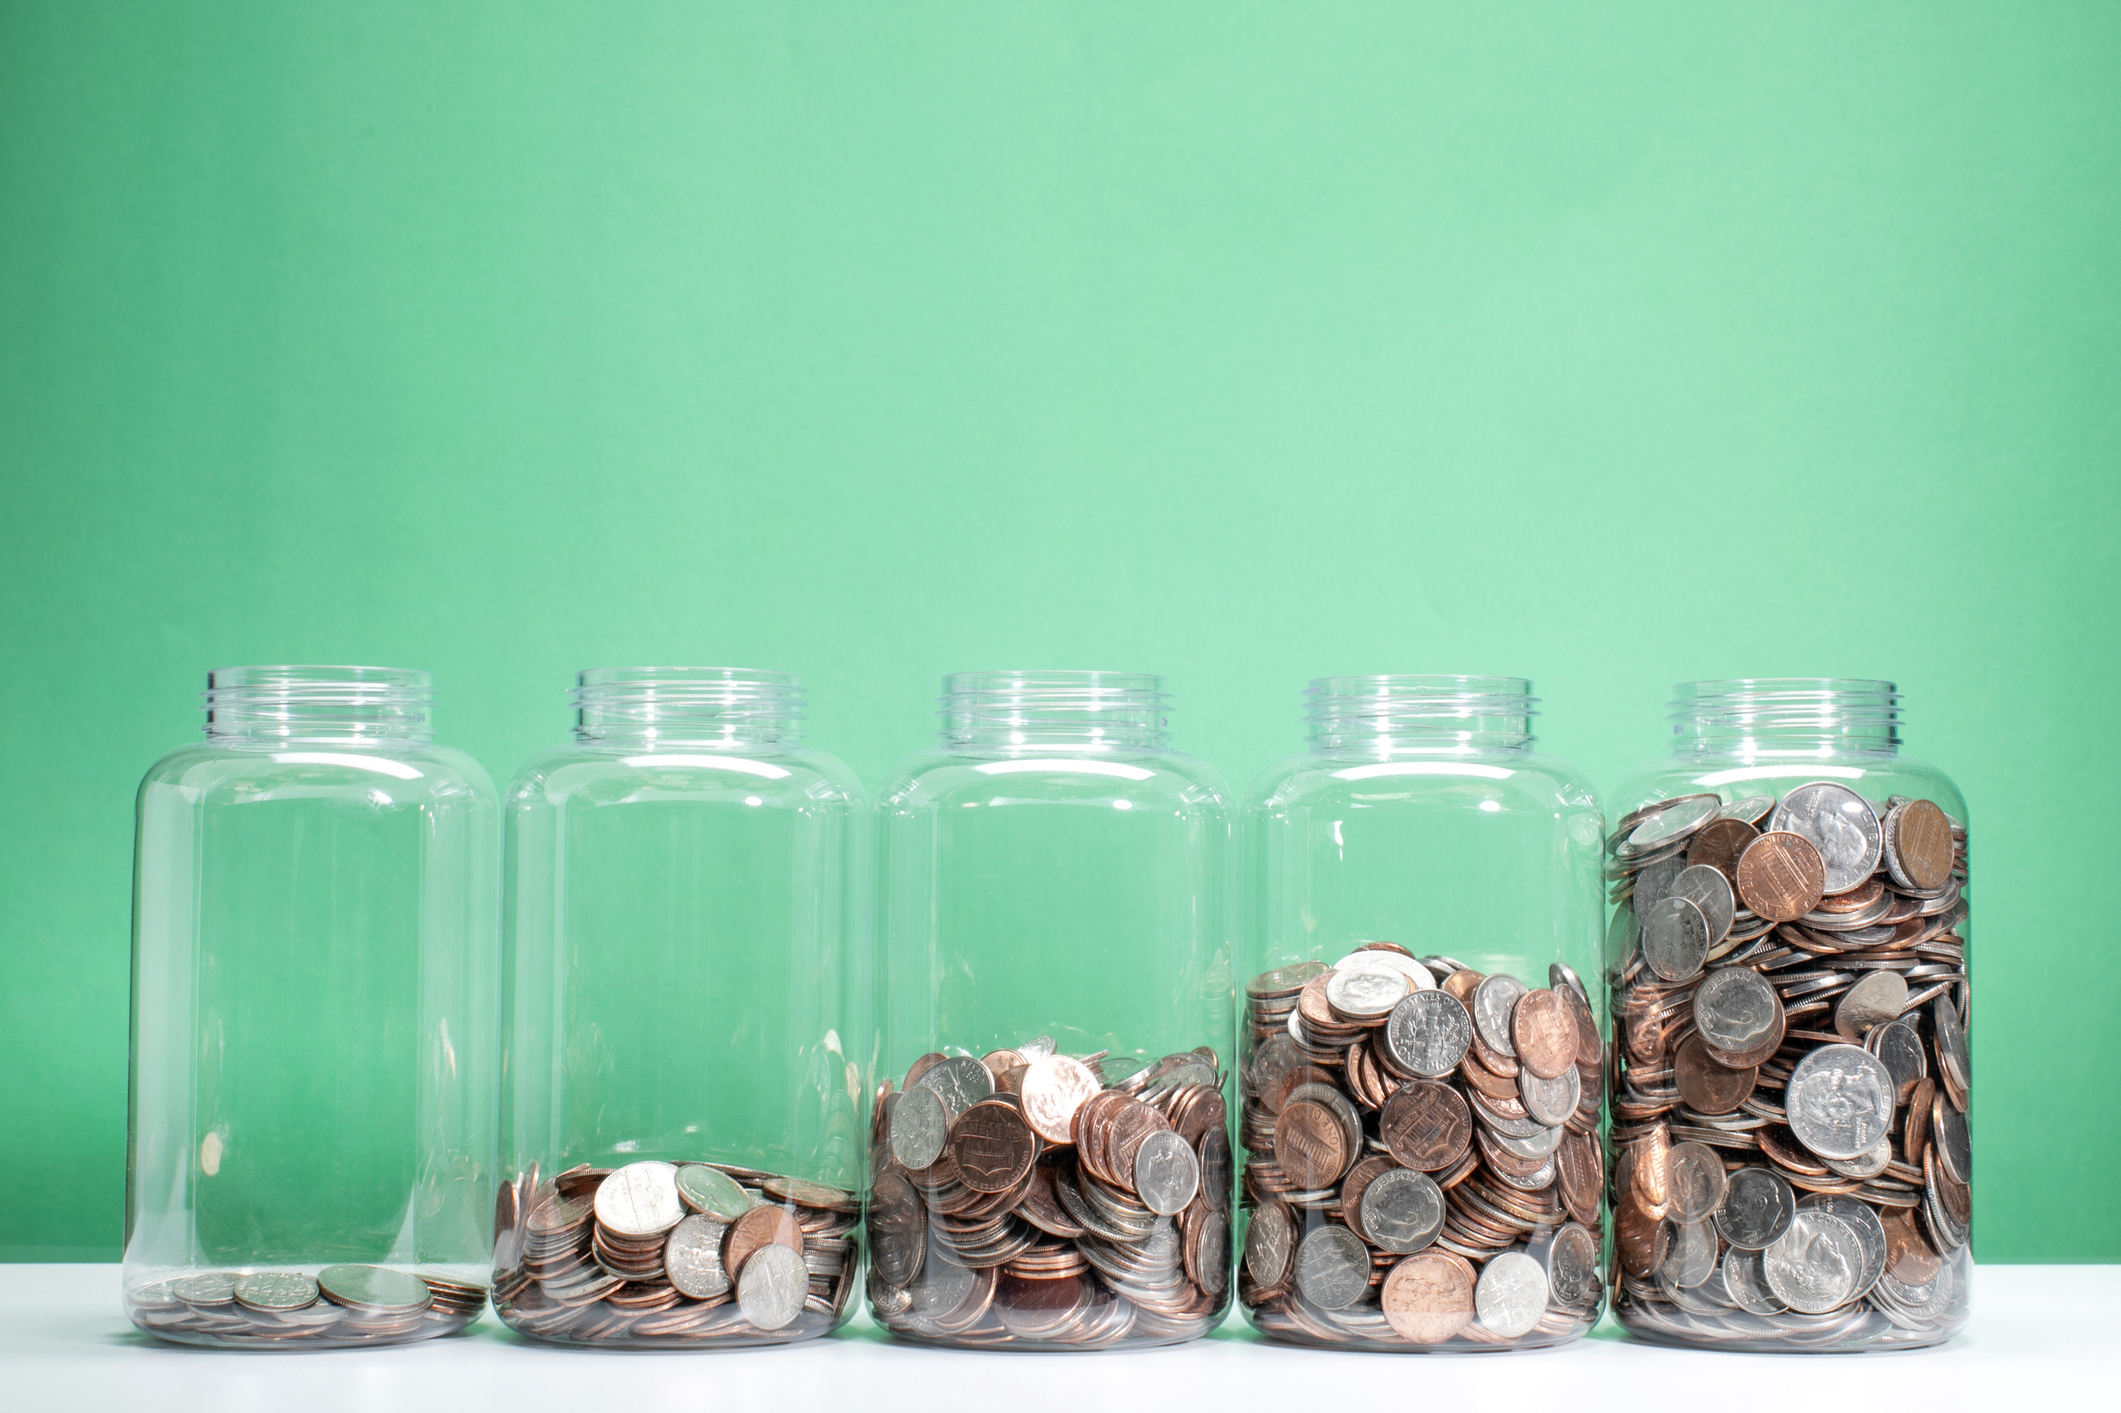
Investors should examine the yield curve for Treasury securities as part of their investment decision-making process. A yield curve is a way to measure bond investors' feelings about risk, and can impact the returns you receive on your investments. If you understand how it works and how to interpret it, a yield curve can even be used to help gauge the direction of the economy.
Yield curves track interest rates across different time periods, from one month to 30 years, giving lenders and borrowers an idea of the cost of money over time. The slope of the yield curve predicts interest rate changes and economic activity. You can use the yield curve to make predictions about the economy to make investment decisions.
Rates on bonds of different maturities behave independently of each other with short-term rates and long-term rates often moving in opposite directions. By comparing long- and short-term bond yields, the yield curve describes future trends in bond returns.
From just $107.88 $24.99 for Kiplinger Personal Finance
Become a smarter, better informed investor. Subscribe from just $107.88 $24.99, plus get up to 4 Special Issues

Sign up for Kiplinger’s Free Newsletters
Profit and prosper with the best of expert advice on investing, taxes, retirement, personal finance and more - straight to your e-mail.
Profit and prosper with the best of expert advice - straight to your e-mail.
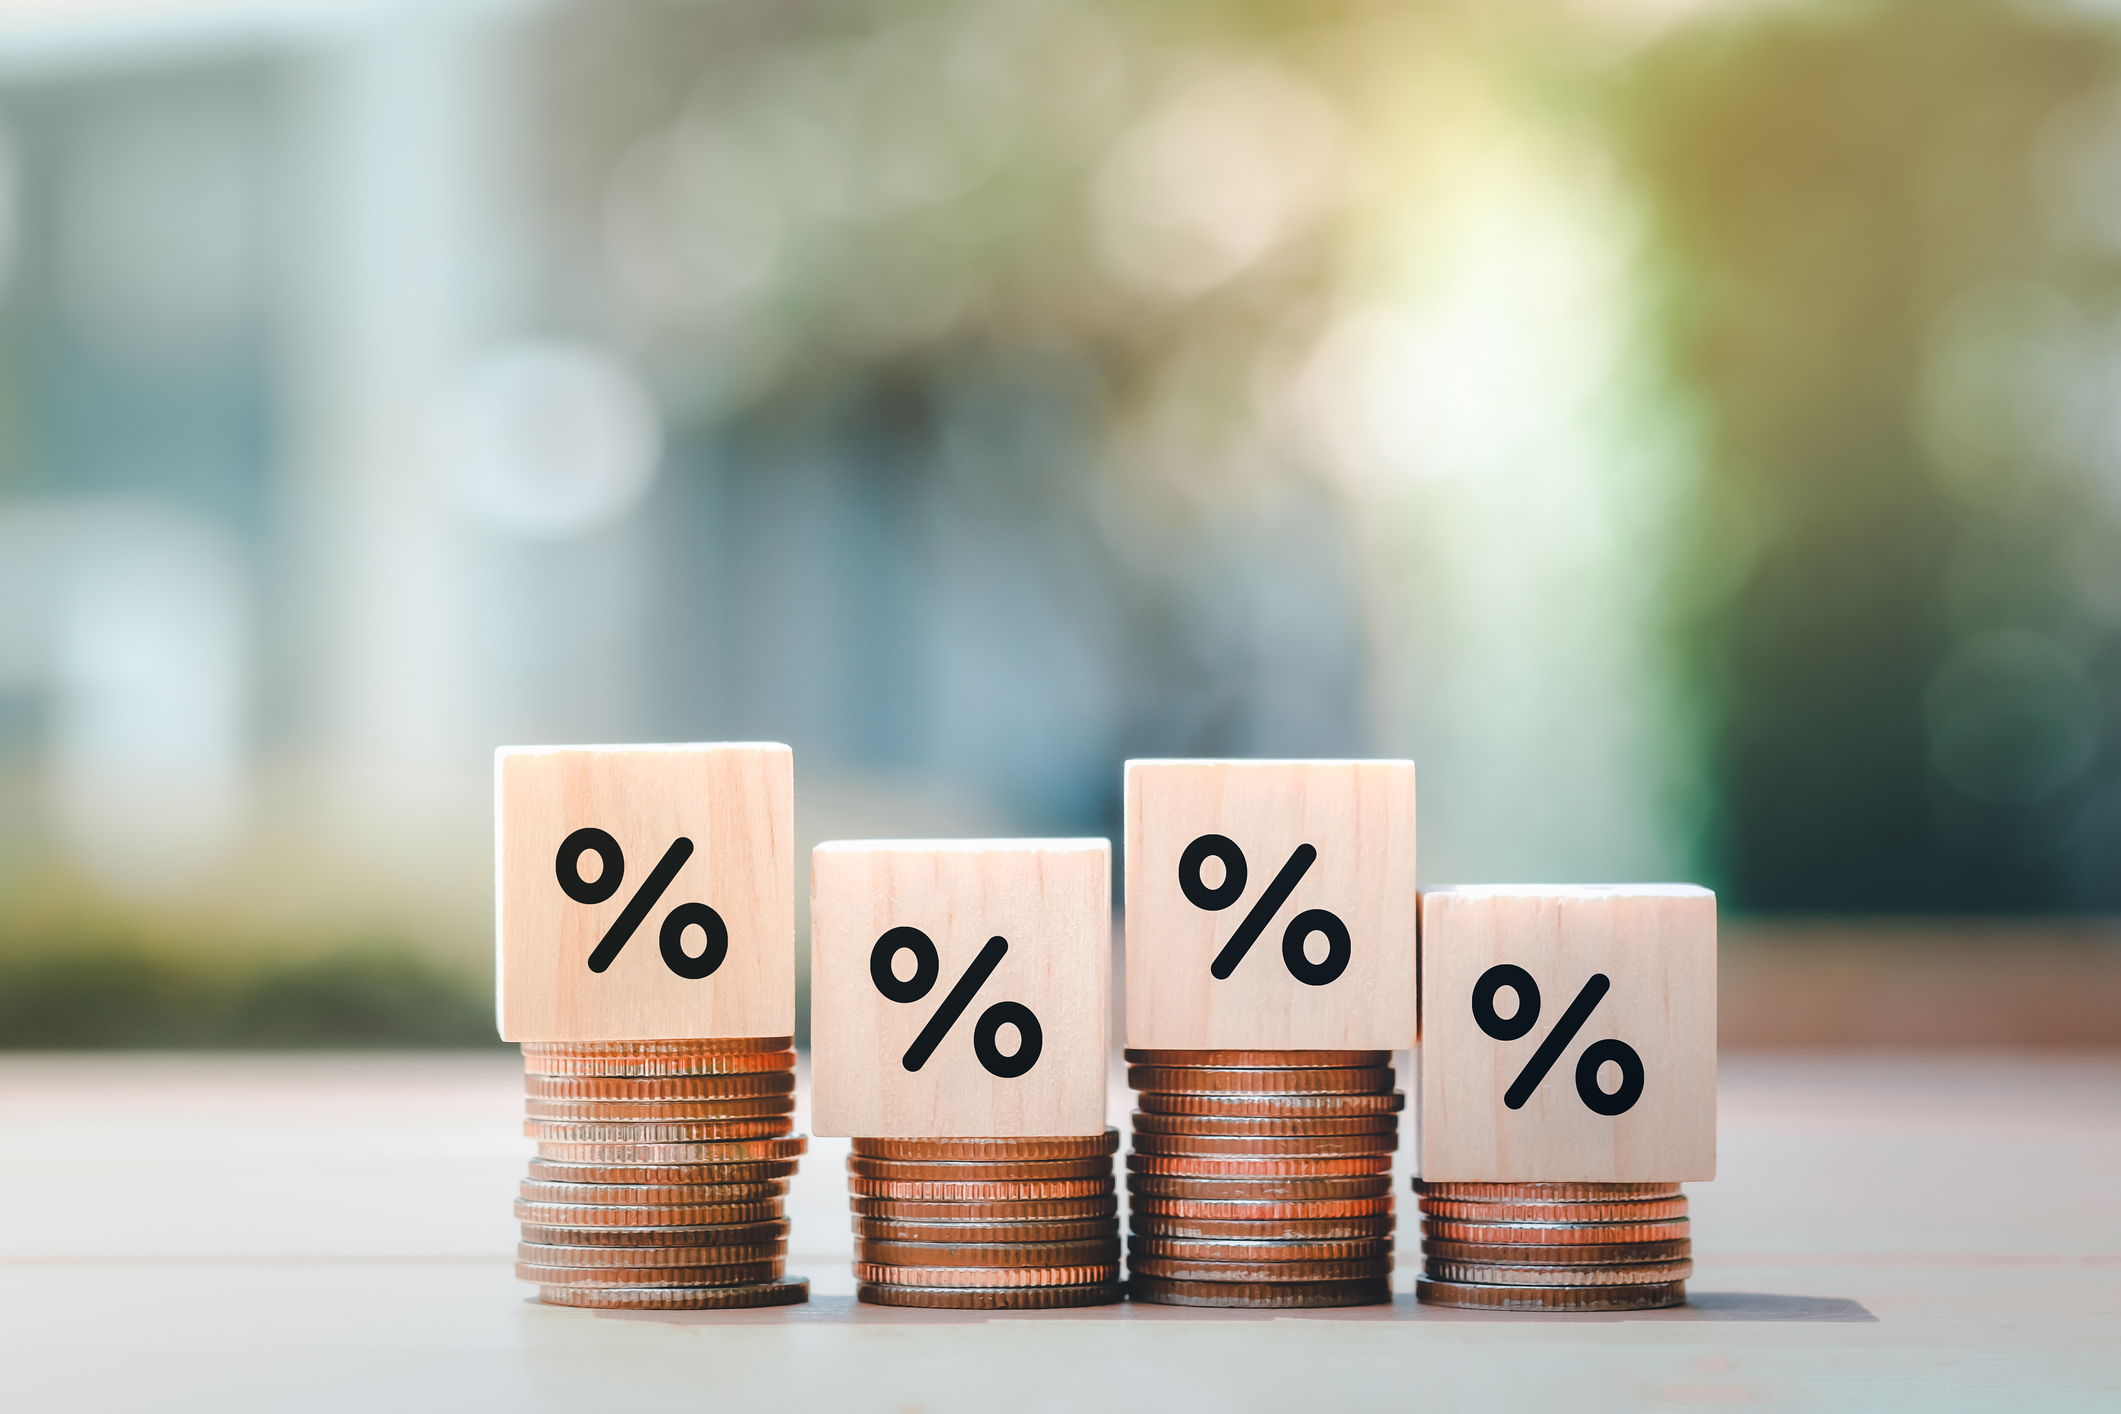
What is a yield curve?
A yield curve is a line that plots yields, or interest rates, of bonds that have equal credit quality but differing maturity dates. The slope of the yield curve can predict future interest rate changes and economic activity.
There are four types of yield curve shapes: normal upward-sloping curve, inverted downward-sloping curve, steep and flat/humped.
The normal curve is generally upward sloping — with the rates of one-year bonds a few percentage points below the rates of 30-year bonds — in times of economic growth. The upward slope reflects the added risk of keeping a bond for a longer period of time. The longer a bond's term, the greater the chance that its payments could decrease due to economic risks.
When the yield curve moves to the inverted, humped or flat — it can mean trouble ahead.
Using the yield curve
Yield curves are used as benchmarks for other debt in the market, such as mortgage rates or bank lending rates, and can often predict changes in economic output and growth.
The most frequently reported yield curve is the U.S. Treasury yield curve. It compares the three-month, two-year, five-year, 10-year, and 30-year U.S. Treasury debt. Yield curve rates are available at the Treasury's interest rate websites each trading day. You can find the Daily Treasury Par Yield Curve Rates at the U.S. Department of the Treasury site.
Types of yield curves
Here are four types of yield curves. Each type signals a different turning point in the economy:
Normal Yield Curve. This is the most common shape for the curve, upward-sloping, and is referred to as the normal curve. The normal yield curve reflects higher interest rates for 30-year bonds as opposed to 10-year bonds. As yields increase over time, the points on the curve exhibit the shape of an upward-sloping curve.
A normal yield curve shows low yields for shorter-maturity bonds and then increases for bonds with a longer maturity, sloping upwards. This curve indicates yields on longer-term bonds continue to rise, responding to periods of economic expansion.
Steep Curve. A steep curve indicates that long-term yields are rising at a faster rate than short-term yields. Steep yield curves have historically indicated the start of an expansionary economic period.
A steep curve can be observed when the small percentage gap between the shortest maturity bonds (i.e. three-month T-bills) and the longest maturity bonds (i.e. 30-year Treasury bonds) widens because some economic force causes the short-term rates to drop more than long-term ones. A steep curve often forecasts a faster-growing economy because lower short-term rates make it easier for companies to borrow money to expand their operations.
Both the normal and steep curves are based on the same general market conditions. The only difference is that a steeper curve reflects a larger difference between short-term and long-term return expectations.
Inverted Yield Curve. In normal economic conditions, investors are rewarded with higher interest rates for holding bonds over longer time periods, resulting in an upward sloping yield curve. This is because these longer returns factor in the risk of inflation or default over time. So when interest rates on long-term bonds fall lower than those of short-term bonds, it results in an inverted yield curve.
An inverted yield curve slopes downward, with short-term interest rates exceeding long-term rates. Such a yield curve corresponds to periods of economic recession, where investors expect yields on longer-maturity bonds to trend lower in the future. In an economic downturn, investors seeking safe investments tend to purchase longer-dated bonds over short-dated bonds, bidding up the price of longer bonds and driving down their yield.
Inverted curves may occur as the Fed raises short-term interest rates, and are always followed by economic slowdown. In fact, analysts have viewed inverted yield curves before each of the last five recessions in the U.S.
Flat/Humped Curve. A flat yield curve reflects similar yields across all maturities, implying an uncertain economic situation. A few intermediate maturities may have slightly higher yields, which causes a slight hump to appear along the flat curve. These humps are usually for mid-term maturities, six months to two years. A flattening of the yield curve usually occurs when there is a transition between the normal yield curve and the inverted yield curve.
A humped yield curve occurs when medium-term yields are greater than both short-term yields and long-term yields. A humped curve is rare and typically indicates a slowing of economic growth.
A common fear is that a humped curve signals the beginning of a recession because the yield curve must pass through this intermediate stage in order to become inverted. Although a humped curve does often signal slower economic growth, the primary force behind an inverted curve is investors' favorable expectations of the future. Other factors such as lower supply of long-term bonds may cause the hump to form.
Bottom line
The yield curve is a simple chart, but it offers a world of useful information. If you’re looking to invest in a bond or CD, the yield curve can tell you where to get the most bang for your buck.
The yield curve affects everything from the rate a bank pays you on a certificate of deposit to what it costs to get a car loan or mortgage. And for investors, the shape of the curve can help indicate which way the economic winds are blowing, and whether there could be a recession in the near future.
Related Content

-
 How to Watch the 2026 Winter Olympics Without Overpaying
Here’s how to stream the 2026 Winter Olympics live, including low-cost viewing options, Peacock access and ways to catch your favorite athletes and events from anywhere.
-
 Here’s How to Stream the Super Bowl for Less
We'll show you the least expensive ways to stream football's biggest event.
-
 The Cost of Leaving Your Money in a Low-Rate Account
Why parking your cash in low-yield accounts could be costing you, and smarter alternatives that preserve liquidity while boosting returns.


-
 The New Fed Chair Was Announced: What You Need to Know
President Donald Trump announced Kevin Warsh as his selection for the next chair of the Federal Reserve, who will replace Jerome Powell.
-
 The U.S. Economy Will Gain Steam This Year
The Kiplinger Letter The Letter editors review the projected pace of the economy for 2026. Bigger tax refunds and resilient consumers will keep the economy humming in 2026.
-
 January Fed Meeting: Updates and Commentary
The January Fed meeting marked the first central bank gathering of 2026, with Fed Chair Powell & Co. voting to keep interest rates unchanged.
-
 Trump Reshapes Foreign Policy
The Kiplinger Letter The President starts the new year by putting allies and adversaries on notice.
-
 Congress Set for Busy Winter
The Kiplinger Letter The Letter editors review the bills Congress will decide on this year. The government funding bill is paramount, but other issues vie for lawmakers’ attention.
-
 The December CPI Report Is Out. Here's What It Means for the Fed's Next Move
The December CPI report came in lighter than expected, but housing costs remain an overhang.
-
 How Worried Should Investors Be About a Jerome Powell Investigation?
The Justice Department served subpoenas on the Fed about a project to remodel the central bank's historic buildings.
-
 The December Jobs Report Is Out. Here's What It Means for the Next Fed Meeting
The December jobs report signaled a sluggish labor market, but it's not weak enough for the Fed to cut rates later this month.


