Is the Stock Market More Volatile Now Than Ever Before?
Daily swings of 200 or 300 points can leave investors feeling more than a little unnerved, but a deeper dive into the numbers over the years may reveal a truth that could help calm those jitters down a bit.


Profit and prosper with the best of Kiplinger's advice on investing, taxes, retirement, personal finance and much more. Delivered daily. Enter your email in the box and click Sign Me Up.
You are now subscribed
Your newsletter sign-up was successful
Want to add more newsletters?

Delivered daily
Kiplinger Today
Profit and prosper with the best of Kiplinger's advice on investing, taxes, retirement, personal finance and much more delivered daily. Smart money moves start here.

Sent five days a week
Kiplinger A Step Ahead
Get practical help to make better financial decisions in your everyday life, from spending to savings on top deals.

Delivered daily
Kiplinger Closing Bell
Get today's biggest financial and investing headlines delivered to your inbox every day the U.S. stock market is open.

Sent twice a week
Kiplinger Adviser Intel
Financial pros across the country share best practices and fresh tactics to preserve and grow your wealth.

Delivered weekly
Kiplinger Tax Tips
Trim your federal and state tax bills with practical tax-planning and tax-cutting strategies.

Sent twice a week
Kiplinger Retirement Tips
Your twice-a-week guide to planning and enjoying a financially secure and richly rewarding retirement

Sent bimonthly.
Kiplinger Adviser Angle
Insights for advisers, wealth managers and other financial professionals.

Sent twice a week
Kiplinger Investing Weekly
Your twice-a-week roundup of promising stocks, funds, companies and industries you should consider, ones you should avoid, and why.

Sent weekly for six weeks
Kiplinger Invest for Retirement
Your step-by-step six-part series on how to invest for retirement, from devising a successful strategy to exactly which investments to choose.
Since I began working in the financial services industry in 1987, I’ve noticed that investors seem to continually feel that the current stock market has been more volatile than it was in the previous five or 10 years. This thinking was brought to my attention once again recently when a client indicated that they felt like the stock market today was more volatile than it has been in the past. I agreed that it sure feels that way. But is it really?
I decided to do some research, and I was a little surprised at what I found.
Today it’s not uncommon to have the Dow Jones Industrial Average, a measure of large U.S. company stocks, swing up or down 100 points in a day. In fact, it’s not uncommon to have moves of 200-300 points in a single day. That sounds volatile, right? However, when we dig deeper we find there is more to the story.
From just $107.88 $24.99 for Kiplinger Personal Finance
Become a smarter, better informed investor. Subscribe from just $107.88 $24.99, plus get up to 4 Special Issues

Sign up for Kiplinger’s Free Newsletters
Profit and prosper with the best of expert advice on investing, taxes, retirement, personal finance and more - straight to your e-mail.
Profit and prosper with the best of expert advice - straight to your e-mail.
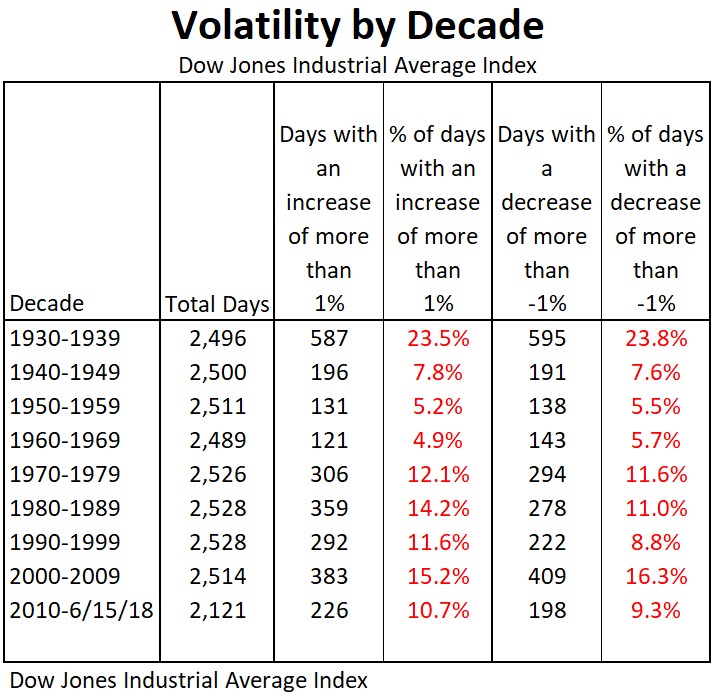
In the chart below I looked at each decade starting in the 1930s and outlined the number of days that the stock market rose or fell more than 1%. What you notice is that since 2010 the number of such days is actually lower than during the previous four decades (1970-2009). So far this decade 11% of the days have been up more than 1% and 9% of the days have been down more than 1%.

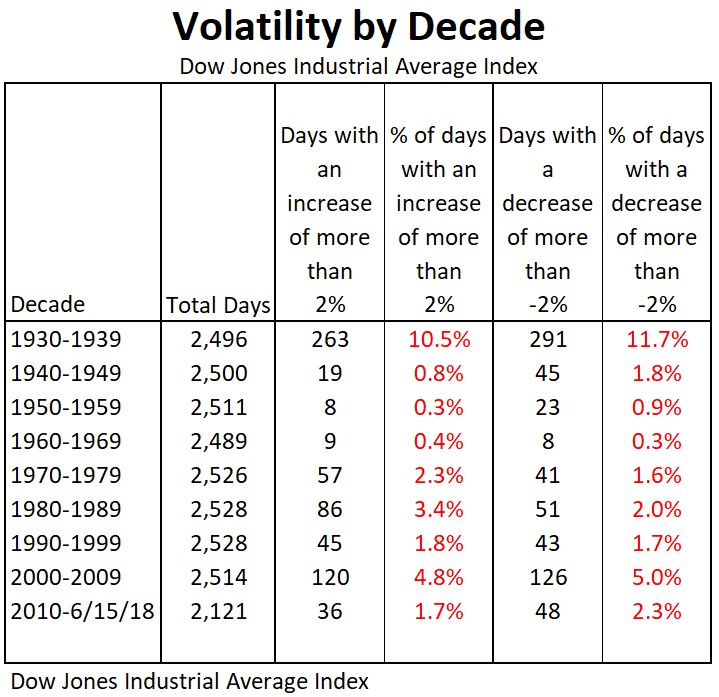
I also looked at days when the index rose or fell 2% or more. The results below show that stock market volatility since 2010 has been quite similar to past decades.

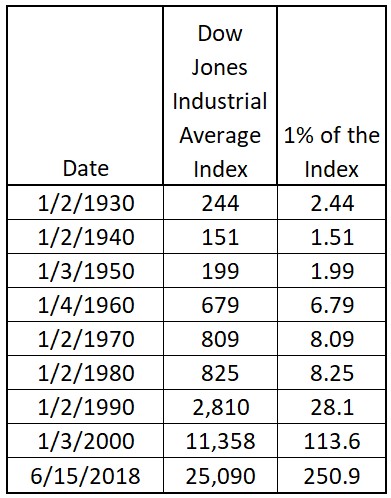
If current stock market volatility is similar to that of the past, why does it feel so much more volatile? The reason is actually quite simple. The index is much larger now, so a 1% move up or down represents a far greater number of points. As you can see in the chart below, on the first trading day of 1980 the Dow closed at 825. One percent of 825 is 8.25 points. Since then the stock market has climbed. By June 15, 2018, the index was up to 25,090. One percent of 25,090 is 250.9 points. So, if the stock market, as measured by the Dow, is now at 25,090 and falls 250.9 points, that is the same as an 8.25-point drop in 1980.

Investors hardly notice days when the Dow drops 8 points now, so naturally when it drops 250 points they feel like volatility has gone sky high by comparison. As you can see, in order to measure volatility, we need to look at the percentage increases and decreases as opposed to the point increases and decreases to get an accurate impression.
Volatility since 2010, as measured by a daily drop or gain of more or less than 1%, has actually been lower than it has been compared to many past decades. Consequently, there is no reason for alarm.
Profit and prosper with the best of Kiplinger's advice on investing, taxes, retirement, personal finance and much more. Delivered daily. Enter your email in the box and click Sign Me Up.

Ray LeVitre is an independent fee-only Certified Financial Adviser with over 20 years of financial services experience. In addition he is the founder of Net Worth Advisory Group and the author of "20 Retirement Decisions You Need to Make Right Now."
-
 The Bear Market Protocol: 3 Strategies to Consider in a Down Market
The Bear Market Protocol: 3 Strategies for a Down Market From buying the dip to strategic Roth conversions, there are several ways to use a bear market to your advantage — once you get over the fear factor.
-
 Dow Adds 1,206 Points to Top 50,000: Stock Market Today
The S&P 500 and Nasdaq also had strong finishes to a volatile week, with beaten-down tech stocks outperforming.
-
 Ask the Tax Editor: Federal Income Tax Deductions
Ask the Editor In this week's Ask the Editor Q&A, Joy Taylor answers questions on federal income tax deductions
-
 The Bear Market Protocol: 3 Strategies to Consider in a Down Market
The Bear Market Protocol: 3 Strategies for a Down Market From buying the dip to strategic Roth conversions, there are several ways to use a bear market to your advantage — once you get over the fear factor.
-
 For the 2% Club, the Guardrails Approach and the 4% Rule Do Not Work: Here's What Works Instead
For retirees with a pension, traditional withdrawal rules could be too restrictive. You need a tailored income plan that is much more flexible and realistic.
-
 Retiring Next Year? Now Is the Time to Start Designing What Your Retirement Will Look Like
This is when you should be shifting your focus from growing your portfolio to designing an income and tax strategy that aligns your resources with your purpose.
-
 I'm a Financial Planner: This Layered Approach for Your Retirement Money Can Help Lower Your Stress
To be confident about retirement, consider building a safety net by dividing assets into distinct layers and establishing a regular review process. Here's how.
-
 The 4 Estate Planning Documents Every High-Net-Worth Family Needs (Not Just a Will)
The key to successful estate planning for HNW families isn't just drafting these four documents, but ensuring they're current and immediately accessible.
-
 Love and Legacy: What Couples Rarely Talk About (But Should)
Couples who talk openly about finances, including estate planning, are more likely to head into retirement joyfully. How can you get the conversation going?
-
 How to Get the Fair Value for Your Shares When You Are in the Minority Vote on a Sale of Substantially All Corporate Assets
When a sale of substantially all corporate assets is approved by majority vote, shareholders on the losing side of the vote should understand their rights.
-
 How to Add a Pet Trust to Your Estate Plan: Don't Leave Your Best Friend to Chance
Adding a pet trust to your estate plan can ensure your pets are properly looked after when you're no longer able to care for them. This is how to go about it.